
H2M 2019 Geometry Question 8
Loading the math board and drawing, please wait…
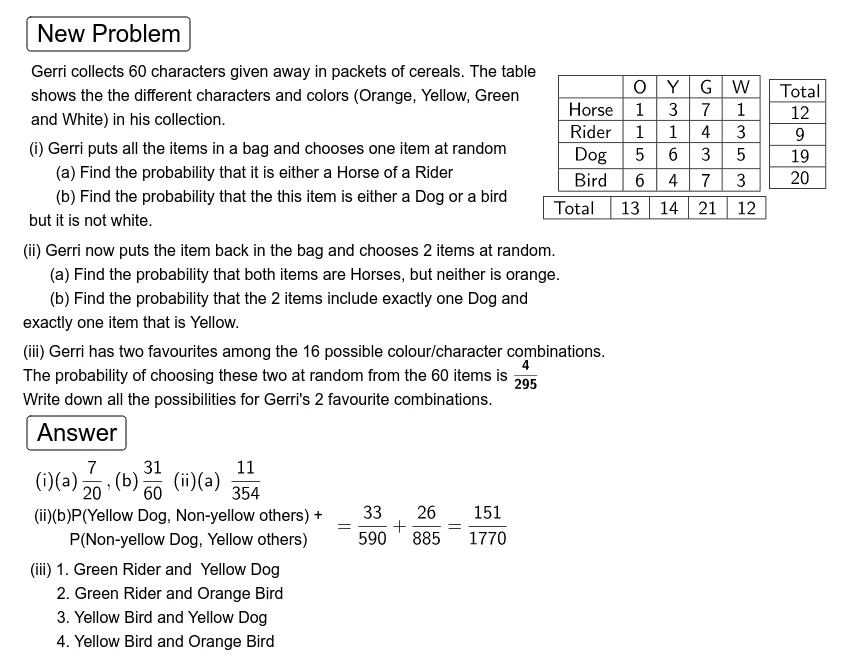
This example demonstrates the probability problem from H2M 2019 Geometry Question 8. The core mathematical concepts involved are probability & statistics and function graphing. Using GeoGebra commands such as Random, Shuffle, If, etc., it dynamically constructs geometric figures. Suitable for high school math education and learning.
GeoGebra Commands & Parameters
Random(1, 3) → aShuffle({1, 1, 1, 1, 1, 1, 1, 1, 4, 4, 5, 5, 6, 6, 7, 7}) → l14, {1, 6, 1, 4, 6, 5, 7, 5, 1, 7, 1, 1, 1, 1, 1, 4}Shuffle({1, 1, 1, 1, 1, 1, 3, 3, 4, 4, 5, 5, 6, 6, 7, 7}) → l15, {1, 7, 1, 4, 1, 6, 3, 3, 7, 1, 1, 5, 5, 4, 6, 1}Shuffle({1, 1, 1, 1, 3, 3, 3, 3, 4, 4, 5, 5, 6, 6, 7, 7}) → l16, {1, 7, 3, 3, 4, 4, 6, 6, 7, 5, 3, 1, 5, 1, 3, 1}If(g ≟ 1, l14, If[g ≟ 2, l15, l16]) → l17Sum(l17) → nSequence(Random[1, 16], i, 1, n) → l1Sequence(Element[l17, i], i, 1, 4) → l2Sequence(Element[l17, i], i, 5, 8) → l3Sequence(Element[l17, i], i, 9, 12) → l4Sequence(Element[l17, i], i, 13, 16) → l5Sum(l2) → s1Sum(l3) → s2Sum(l4) → s3Sum(l5) → s4Join({{"Horse"}, l2}) → l7Join({{"Rider"}, l3}) → l8Join({{"Dog"}, l4}) → l9Join({{"Bird"}, l5}) → l10Join({{"Total "}, l6}) → l11TableText(l12, l7, l8, l9, l10, "c|_") → text1TableText(l11, "c|_") → text5TableText(l13, "c|_") → text6IndexOf(4, l17) → bIndexOf(4, l17, b + 1) → cIf(a ≟ 1, IndexOf[6, l17], If[a ≟ 2, IndexOf[5, l17], IndexOf[7, l17]]) → dIf(a ≟ 1, IndexOf[6, l17, d + 1], If[a ≟ 2, IndexOf[5, l17, d + 1], IndexOf[7, l17, d + 1]]) → eIf(Mod[b, 4] ≟ 1, "Orange", If[Mod[b, 4] ≟ 2, "Yellow", If[Mod[b, 4] ≟ 3, "Green", "White"]]) → text12If(b ≤ 4, "Horse", If[b ≤ 8, "Rider", If[b ≤ 12, "Dog", "Bird"]]) → text13If(Mod[c, 4] ≟ 1, "Orange", If[Mod[c, 4] ≟ 2, "Yellow", If[Mod[c, 4] ≟ 3, "Green", "White"]]) → text14If(c ≤ 4, "Horse", If[c ≤ 8, "Rider", If[c ≤ 12, "Dog", "Bird"]]) → text15If(Mod[d, 4] ≟ 1, "Orange", If[Mod[d, 4] ≟ 2, "Yellow", If[Mod[d, 4] ≟ 3, "Green", "White"]]) → text16If(d ≤ 4, "Horse", If[d ≤ 8, "Rider", If[d ≤ 12, "Dog", "Bird"]]) → text17If(Mod[e, 4] ≟ 1, "Orange", If[Mod[e, 4] ≟ 2, "Yellow", If[Mod[e, 4] ≟ 3, "Green", "White"]]) → text18If(e ≤ 4, "Horse", If[e ≤ 8, "Rider", If[e ≤ 12, "Dog", "Bird"]]) → text19If(a ≟ 1, 48 / ((n * (n - 1))), If[a ≟ 2, 40 / ((n * (n - 1))), 56 / ((n * (n - 1)))]) → f
AI Drawing Prompt Reference
Create a dynamic geometric figure related to probability and statistics, involving randomly generated number sequences and categorized statistical results. Start by generating three random sequences representing quantities of different categories, then dynamically allocate numbers to five groups based on these quantities. Next, calculate the sum of each group and display the sums combined with category labels. Finally, determine the color and category of specific elements based on randomly selected categories and indices, and show the related probability calculation results.
The prompt above was compiled from the original drawing commands and is for reference only.