
Graphical Construction of Derivatives and Tangent Slopes
Loading the math board and drawing, please wait…
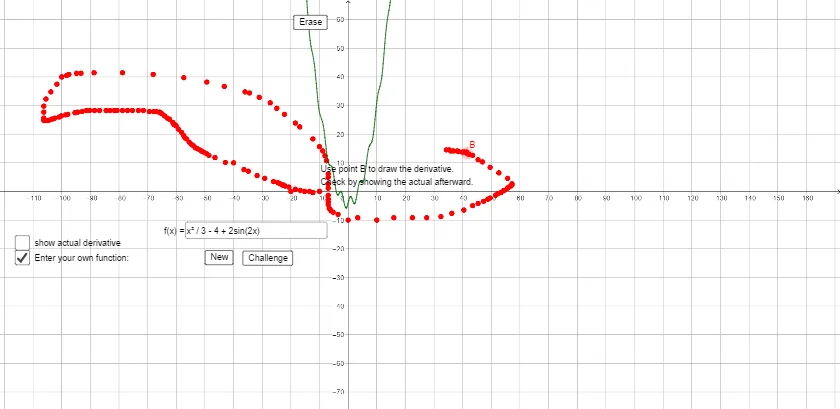
This example demonstrates the geometric meaning of derivatives by drawing the tangent line on a function graph and visualizing its slope as a local rate of change. It centers on core ideas from Calculus: the derivative, the tangent slope (Slope), representing the function and its derivative (f and f'), and using these to interpret how the graph changes at a chosen point. In the GeoGebra construction, Derivative is used to compute/create the derivative object, Slope is used to obtain the tangent slope value, and Segment together with curve/point elements builds the tangent-line geometry. Textfield/Text objects provide labels such as f, f', and the slope-related variable. Interactive controls (buttons and input fields) update the selected point and refresh the tangent and slope display. Suitable for late high school and early college students learning or reviewing derivatives, tangent lines, and graphical understanding of local linear approximation.
GeoGebra Commands & Parameters
Derivative(f) → f'Slope(Tangent[A, f]) → mSegment(A + (-1, (-m)) / 2, A + (1, m) / 2) → gTextfield(f) → InputBox2Element(list1, c + 1) → p
AI Drawing Prompt Reference
Draw a function graph and display a tangent line on it that passes through a point on the function. Show the slope of the tangent line at that point to illustrate the concept of derivatives geometrically. The graph should include the function curve, the tangent line, the point of tangency, and the slope value. Include interactive controls to move the point of tangency, updating the tangent line and slope display in real-time, with text labels for the function name, its derivative, and the slope value.
The prompt above was compiled from the original drawing commands and is for reference only.