
Exploring the Derivative as a Function
Loading the math board and drawing, please wait…
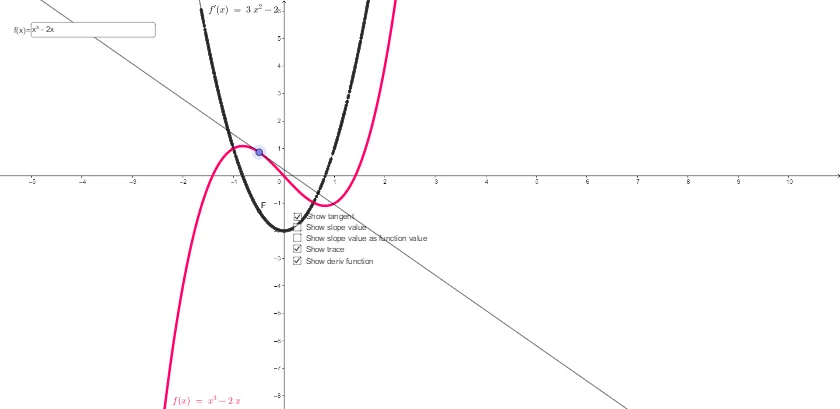
① This GeoGebra example dynamically visualizes how the derivative of a function forms a new graph while displaying the original function’s tangent line and its slope at any point. ② Key mathematical concepts include the definition of the derivative, the geometric interpretation of the derivative function, tangent line equations, and the relationship between slope and derivative. ③ The construction uses GeoGebra commands such as Derivative, Point, Tangent, Slope, Segment, and interactive controls like Textfield, InputBox1, and InputBox2 to enable user input and real‑time manipulation. ④ Designed for high‑school to early university students, it serves as an effective tool for teaching derivative concepts, function graphing, and interactive mathematical exploration.
GeoGebra Commands & Parameters
Derivative(f) → f'Point(f) → ATangent(A, f) → aSlope(a) → mSegment(C, B) → bSegment(D, E) → cTextfield(f) → InputBox1Textfield(A) → InputBox2
AI Drawing Prompt Reference
Draw a function curve together with its derivative curve; place a draggable point on the original curve, automatically draw the tangent line at that point and show its slope value; provide two input fields to change the function expression and the point’s x‑coordinate so the diagram updates in real time. The tangent line should be drawn as a straight segment touching the curve, and the slope displayed as a numeric label near the point.
The prompt above was compiled from the original drawing commands and is for reference only.