
Linear/Linear Rational Function Quiz
Loading the math board and drawing, please wait…
In collections
Grade 12 PreCalculus BC
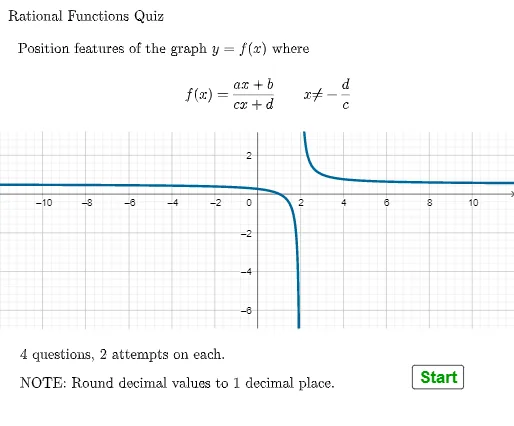
This example demonstrates the plotting of linear/linear rational functions and their key features. It involves core math concepts like function graphs, difference and slope, and properties of rational functions. Construction highlights include using commands like Line, Point, Random, Remove, RandomElement, If, Simplify, Corner, FractionText along with GeoGebra objects such as STUDVA, STUDX, STUDY, etc. Suitable for high school mathematics education, focusing on function graph analysis and plotting skills.
GeoGebra Commands & Parameters
Line(C, D) → iPoint(i) → STUDVAPoint(xAxis) → STUDXPoint(yAxis) → STUDYRandom(-6, 6) → bBRemove(dDlist1, {bB, (-bB)}) → dDlist2RandomElement(dDlist2) → dDranlist2RandomElement(dDlist1) → dDranlist1RandomElement(alist) → aAranRandomElement(clist) → cCIf(aA ≟ cC, dDranlist2, If[aA ≟ (-cC), dDranlist2, dDranlist1]) → dDLine(F, G) → jPoint(j) → STUDHASimplify((aA * x) + bB) → fSimplify((cC * x) + dD) → gCorner(5) → dimsFractionText(exempt) → exemptfrac
AI Drawing Prompt Reference
Plot a rational function formed by dividing one linear function by another, and highlight its key features. Start by drawing two reference lineshol, then place draggable points on each line to represent the independent variable and function value. Randomly generate coefficients for the numerator and denominator, ensuring the denominator is nonzero and the two functions are not identical. Mark points on the coordinate axeshol, and display the simplified expressions of both linear functions. Finally, show a fractional text representation in a corner of the plot. The graph is intended for analyzing slope, difference, and properties of rational functions.
The prompt above was compiled from the original drawing commands and is for reference only.