
Derivatives as Tangent Slopes Dynamic Demo
Loading the math board and drawing, please wait…
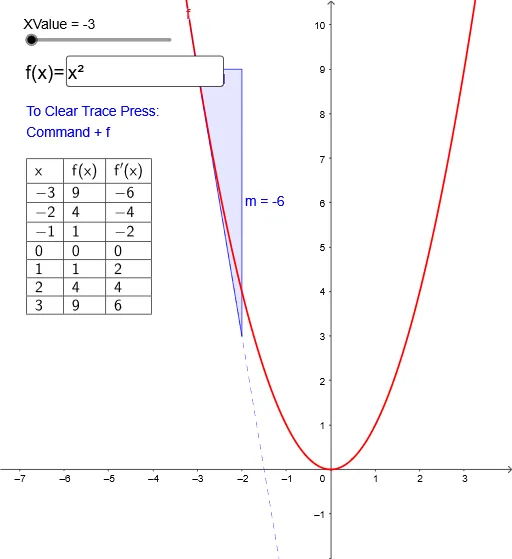
This GeoGebra example dynamically visualizes the derivative as the slope of a tangent line to a function graph. It demonstrates the fundamental geometric meaning of derivatives, including local linear approximation, identification of extrema via Max and Min commands, and interactive exploration through Textfield, Tangent, and Slope objects. The construction leverages key GeoGebra commands such as Max, Min, Textfield, Tangent, Slope, and TableText, along with function f, its derivative f', the variable XValue, and various point objects to create a responsive educational tool. It is ideal for high school calculus courses, undergraduate mathematics fundamentals, and independent learners exploring derivative concepts.
GeoGebra Commands & Parameters
Max(f, -3, 3) → CMin(f, -3, 3) → DMax(f', -3, 3) → EMin(f', -3, 3) → FTextfield(f) → InputBox1Tangent(A, f) → gSlope(g) → mTableText({{A1, B1, C1}, {A2, B2, C2}, {A3, B3, C3}, {A4, B4, C4}, {A5, B5, C5}, {A6, B6, C6}, {A7, B7, C7}, {A8, B8, C8}}, "|_") → text2