
Coordinates and Linear Functions
Loading the math board and drawing, please wait…
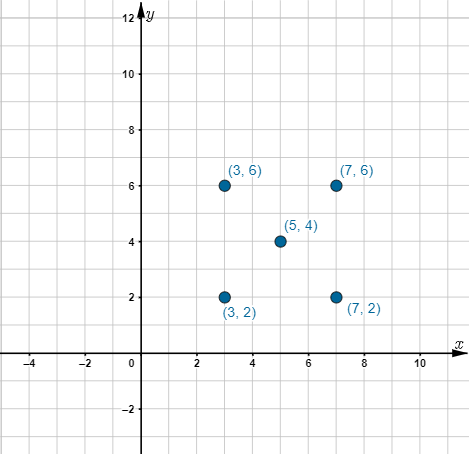
This example explores linear functions through their graphs, helping students understand the basic properties of linear functions. By constructing points A, B, C, D, and E, students can observe how the slope and y-intercept of a linear function affect its graph. The core mathematical concepts involved include the definition of linear functions, their graph characteristics, and how to construct them using GeoGebra commands. Suitable for students in middle school and above to learn about linear functions.
GeoGebra Commands & Parameters
Point A(3, 2)Point B(7, 2)Point C(3, 6)Point D(5, 4)Point E(7, 6)
AI Drawing Prompt Reference
Plot five points on a coordinate plane to illustrate key features of linear functions. Start by placing points (3,2) and (7,2), then add point (3,6). Next, include point (5,4) and point (7,6). The set should show two horizontally aligned groups (with two points on the lower level and two on the upper level) together with the middle point (5,4), providing a reference for how slope and the y-intercept relate to the points’ positions.
The prompt above was compiled from the original drawing commands and is for reference only.