
Exponential and Logarithmic Functions by Anjana
Loading the math board and drawing, please wait…
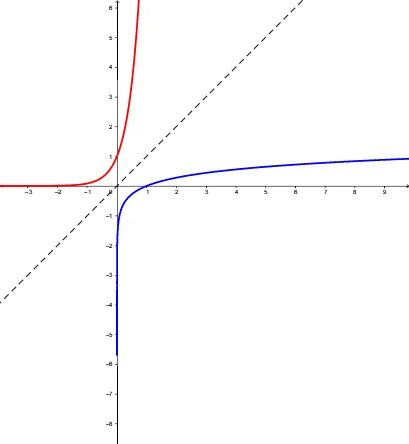
This example demonstrates the graphs of exponential and logarithmic functions, their intersection points, and related concepts like angles, LCM/GCD, and 3D vectors. It uses GeoGebra commands such as Point, Line, Mirror, and objects like sliders and text elements to illustrate key mathematical ideas, suitable for high school mathematics education and function graph analysis.
GeoGebra Commands & Parameters
Point(g) → APoint(g) → BLine(A, B) → aMirror(f, a) → f_1
AI Drawing Prompt Reference
On a coordinate plane, place two points at specified locations and draw the straight line through them. Then take an existing curve and reflect it across the newly drawn line to produce the mirrored curve. Display the original curve, the reflected curve, and the reflection line together in one figure, emphasizing the symmetry relationship between the two curves.
The prompt above was compiled from the original drawing commands and is for reference only.