
Graph of Exponential Functions
Loading the math board and drawing, please wait…
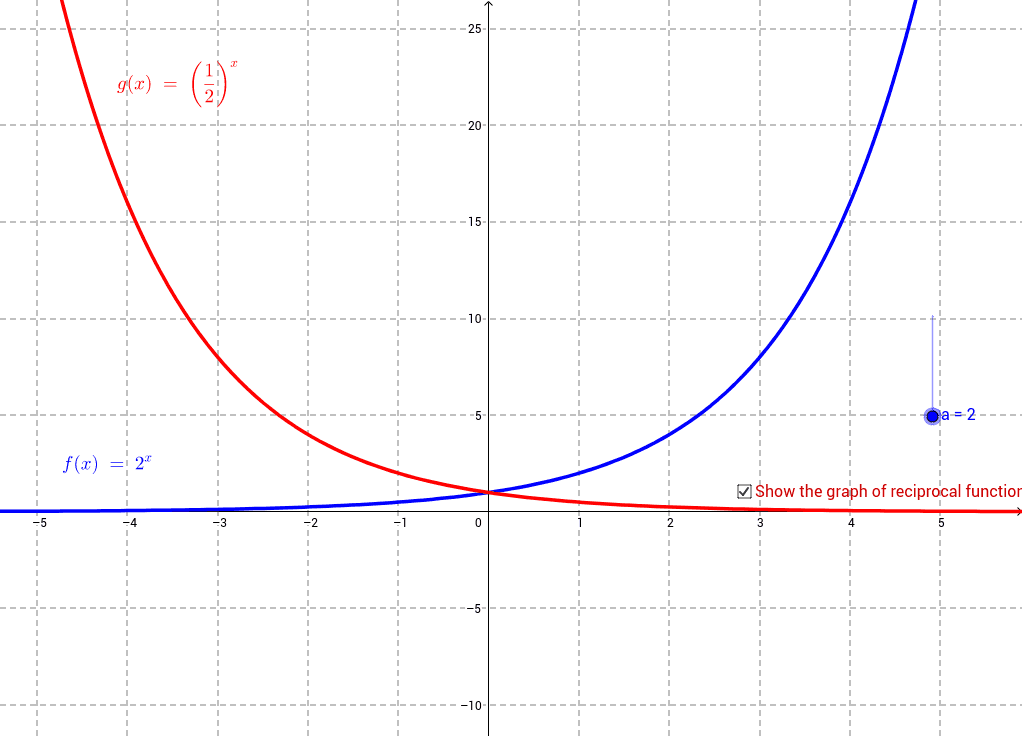
This GeoGebra courseware allows students to investigate the graph of exponential functions interactively, while teachers can use it for classroom demonstration. By adjusting sliders for parameters a and b, users can observe how the function f(x)=a*b^x changes its shape, position, and monotonicity. Core mathematical concepts include the definition of exponential functions, key graph features such as the y-intercept and horizontal asymptote, the effect of the base on growth or decay, and transformations like vertical scaling and translation. The construction uses sliders to control parameters, defines functions f and g, and plots their graphs. Additional objects such as straight lines, secant lines, polygons, and roots are included to illustrate intersections, slopes, and other properties. This resource is suitable for high school mathematics classes, teacher-led demonstrations, and introductory calculus courses, helping learners visualize exponential growth and decay in a dynamic way.
GeoGebra Commands & Parameters
Numeric a(2.0)f(x) = a^(x)Boolean b(true)g(x) = (1 / a)^(x)
AI Drawing Prompt Reference
Create a dynamic graph of exponential functions with a slider to adjust the base value and a toggle to show a mirrored function. The main curve represents an exponential function whose shape changes with the slider, showing growth or decay. When the toggle is on, display a second curve that is the reflection of the first across the y-axis, corresponding to the reciprocal base. Both curves pass through the point (0,1) and approach the x-axis as an asymptote. Clearly label the axes, include gridlines, and highlight the intersection and symmetry between the two curves to illustrate the properties of exponential functions.
The prompt above was compiled from the original drawing commands and is for reference only.