
GeoGebra Polynomial Graphing Interactive Applet
Loading the math board and drawing, please wait…
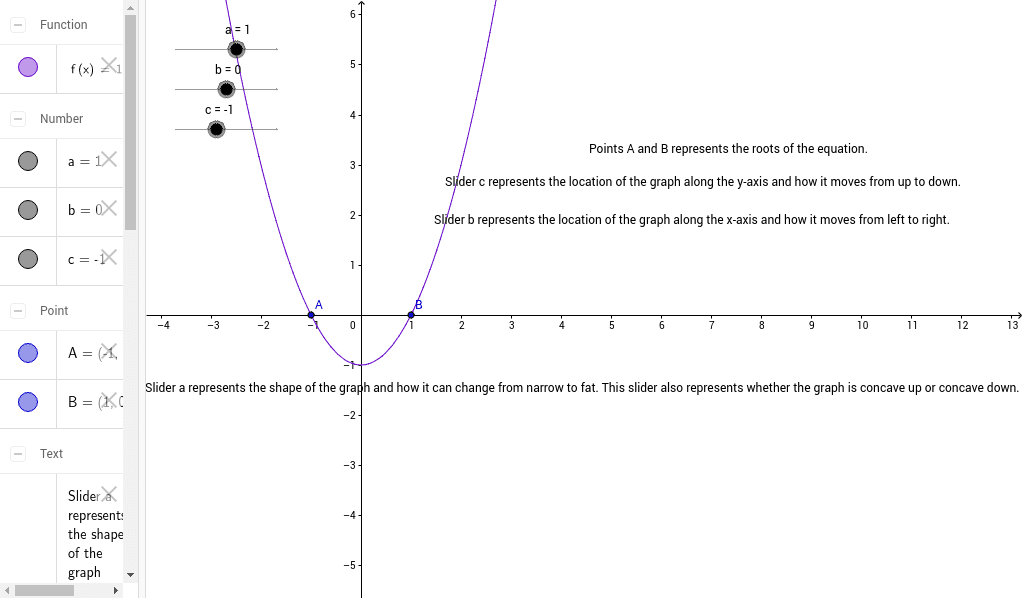
This GeoGebra applet helps students visualize and explore polynomial function graphs. By dynamically adjusting coefficients, learners can observe how the graph's shape, roots, turning points, and end behavior change. The demonstration covers key concepts such as polynomial functions, continuity, root finding, and the effect of coefficients on graph morphology. Construction uses the Intersect command to compute intersection points, along with function objects, coordinate points, and text labels for dynamic annotations. It is suitable for high school algebra, pre-calculus, and introductory calculus courses, serving as both a teacher-led demonstration and a student inquiry tool.
GeoGebra Commands & Parameters
Intersect(f, xAxis, 1) → AIntersect(f, xAxis, 2) → B
AI Drawing Prompt Reference
Draw an interactive polynomial function graph with adjustable coefficients, showing the coordinate axes, the curve itself, its two intersections with the x-axis representing real roots, turning points indicating local extrema, and changes in concavity; provide dynamic annotations for the root coordinates, turning point coordinates, and the current function equation, demonstrating how modifying coefficients alters the graph's overall shape, the number and position of roots, and the end behavior as x approaches infinity.
The prompt above was compiled from the original drawing commands and is for reference only.