
Area Under the Curve by Mathguru
Loading the math board and drawing, please wait…
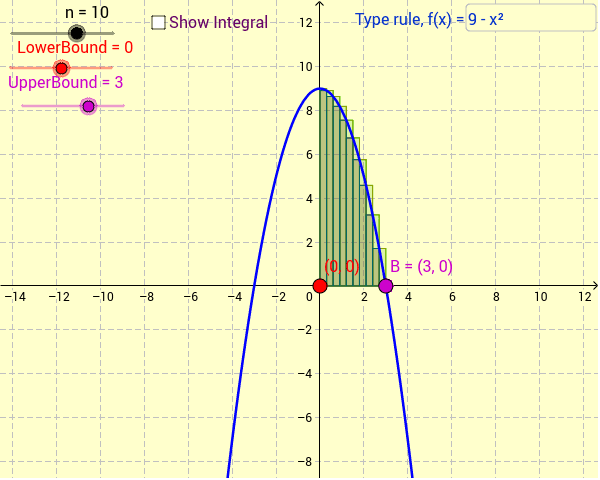
This GeoGebra applet allows users to input a function and adjust the lower and upper bounds and the number of divisions to calculate the area under the curve. It demonstrates the concepts of integration and Riemann sums. Commands used include Textfield, UpperSum, LowerSum, Integral, LeftSum, and RectangleSum. Suitable for high school mathematics education and learning.
GeoGebra Commands & Parameters
Textfield(f) → inputBox2UpperSum(f, LowerBound, UpperBound, n) → cLowerSum(f, LowerBound, UpperBound, n) → dIntegral(f, LowerBound, UpperBound) → gLeftSum(f, LowerBound, UpperBound, n) → aRectangleSum(f, LowerBound, UpperBound, n, 1) → r
AI Drawing Prompt Reference
Draw the area under the curve of function f(x) in the interval [a, b], approximated by n rectangles for both upper and lower Riemann sums, and the exact integral value. First, input the function f(x), then adjust the interval endpoints a and b, and the number of rectangles n, to observe the changes in the upper and lower Riemann sum rectangles and compare them with the exact integral value.
The prompt above was compiled from the original drawing commands and is for reference only.