
Function Graphing and Export
Loading the math board and drawing, please wait…
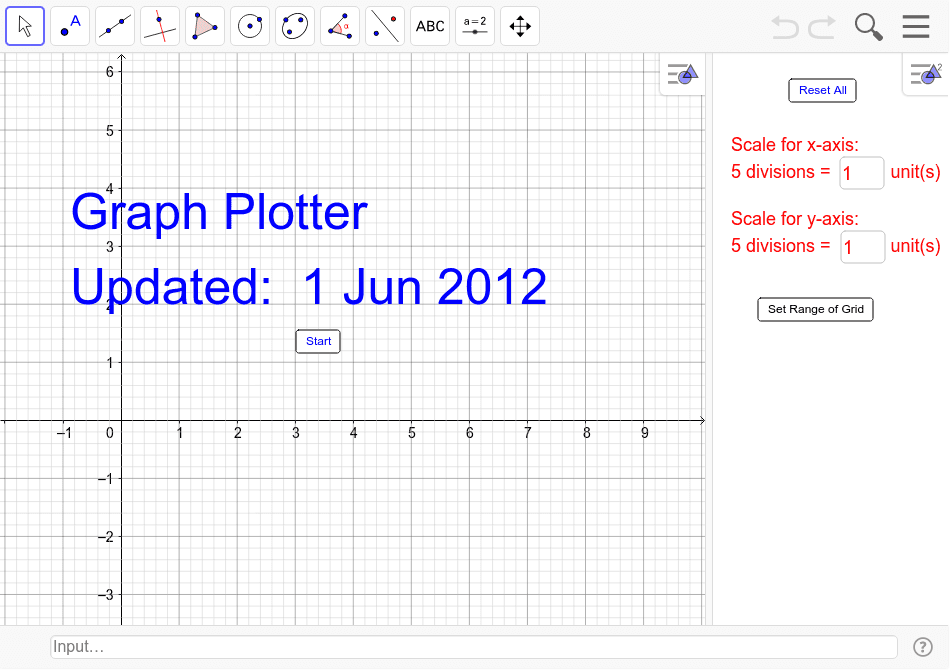
This applet helps teachers graph functions on graph paper and export them in eps format to Word documents. It involves core math concepts such as function graphs, equations, and inequalities. Using GeoGebra commands like Sequence and Textfield, it's easy to construct function graphs. Suitable for secondary math education.
GeoGebra Commands & Parameters
Sequence(Sequence[Segment[(xint2 * (j - 1) + xint1 * i, ymax), (xint2 * (j - 1) + xint1 * i, ymin)], i, 1, 4], j, 1, ceil(xmax / xint2)) → list5Sequence(Sequence[Segment[(-xint2 * (j - 1) - xint1 * i, ymax), (-xint2 * (j - 1) - xint1 * i, ymin)], i, 1, 4], j, 1, ceil(abs(xmin) / xint2)) → list5'Sequence(Sequence[Segment[(xmin, (j - 1) * yint2 + yint1 * i), (xmax, (j - 1) * yint2 + yint1 * i)], i, 1, 4], j, 1, ceil(ymax / yint2)) → list6Sequence(Sequence[Segment[(xmin, -(j - 1) * yint2 - yint1 * i), (xmax, -(j - 1) * yint2 - yint1 * i)], i, 1, 4], j, 1, ceil(abs(ymin) / yint2)) → list6'Sequence(Segment[(0 + xint2 * i, ymax), (0 + xint2 * i, ymin)], i, 1, ceil(xmax / xint2)) → list3Sequence(Segment[(-xint2 * i, ymax), (0 - xint2 * i, ymin)], i, 1, ceil(abs(xmin) / xint2)) → list3'Sequence(Segment[(xmin, yint2 * i), (xmax, yint2 * i)], i, 1, ceil(ymax / yint2)) → list4Sequence(Segment[(xmin, -yint2 * i), (xmax, -yint2 * i)], i, 1, ceil(abs(ymin) / yint2)) → list4'Textfield(xmax') → inputBox4Textfield(xmin') → inputBox5Textfield(ymin') → inputBox6Textfield(ymax') → inputBox7Textfield(yint1') → inputBox1Textfield(xint1') → inputBox2
AI Drawing Prompt Reference
Draw a coordinate system with x-axis, y-axis, grid lines, and a function graph. First, draw the x-axis and y-axis. Then, draw the grid lines, including both horizontal and vertical lines. Finally, input the function expression and draw the function graph.
The prompt above was compiled from the original drawing commands and is for reference only.