
Fish Sampling Applet
Loading the math board and drawing, please wait…
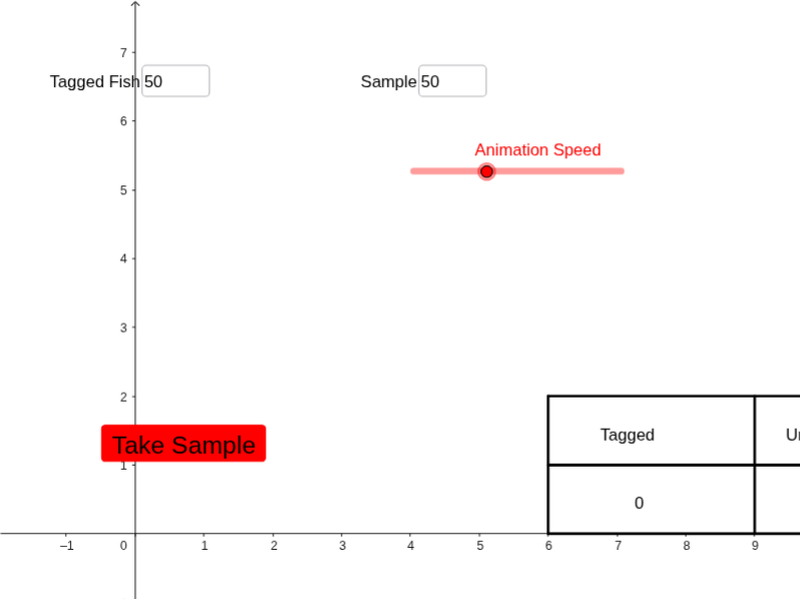
This example demonstrates how to estimate the proportion of a specific type of fish in a population through simulated sampling. It involves core mathematical concepts such as Probability & Statistics, Random Variables, Geometry, Curve Sketching, Sequences and Series, and Upper/Lower Sums or Riemann Sums. The construction utilizes commands like Sequence, Sample, Sum, Textfield, Polygon, Point, and Segment from GeoGebra. It is suitable for high school and above students to learn about sampling methods and their applications in probability and statistics.
GeoGebra Commands & Parameters
Sequence(i, i, 1, fish) → list1Sample(list1, samp) → takesampSequence(If[Element[takesamp, i] ≤ tagged, 1, 0], i, 1, samp) → taggedynSequence(Element[taggedyn, i], i, 1, ani) → anisampSum(anisamp) → totaltaggedTextfield(tagged) → inputBox1Textfield(samp) → inputBox2Polygon(B, C, D, E) → poly1, b, c, d, ePoint(xAxis) → FPoint(xAxis) → GPolygon(E, F, G, D) → poly2, e_1, f, g, d_1Point(b) → HPoint(f) → ISegment(H, I) → a
AI Drawing Prompt Reference
Create a statistical graph simulating fish population sampling, featuring a geometric polygon representing the fish population and an axis for sampling points. Show the proportion of tagged fish in the population, control the sampling size with a slider, and use geometric shapes to depict the sampled and unsampled parts, plotting the sampling proportion curve on the axis.
The prompt above was compiled from the original drawing commands and is for reference only.