
Dynamic Statistical Measures
Loading the math board and drawing, please wait…
In collections
Statistical Intuition Builders
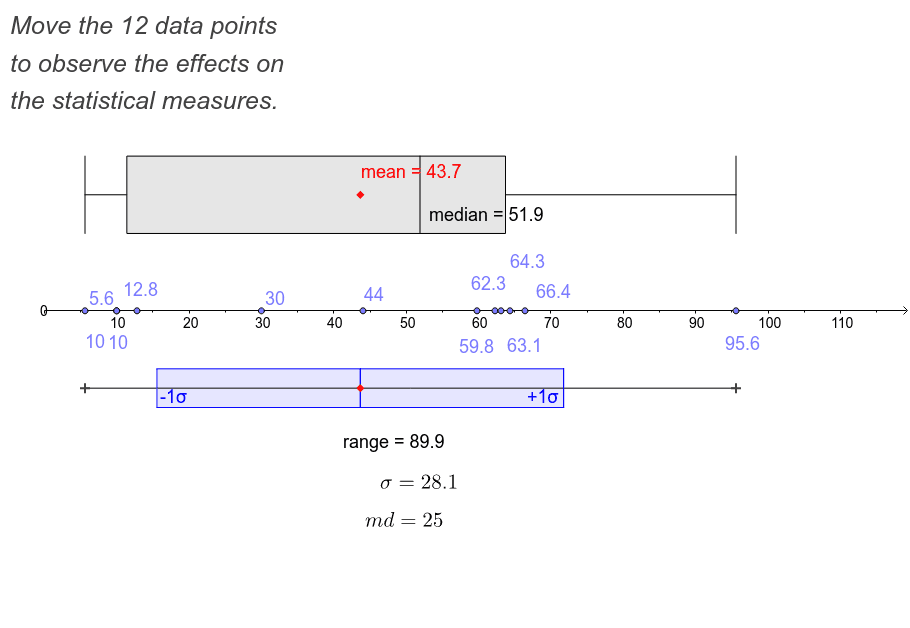
This example demonstrates how mean, median, range, and standard deviation change as you drag data points. It involves core math concepts like mean, median, range, standard deviation, and data distribution. Constructed using GeoGebra commands and objects such as Segment, Point, MeanX, SDX, Min, Polygon, Mean, BoxPlot. Suitable for high school mathematics teaching to visually understand the dynamic changes of statistical measures.
GeoGebra Commands & Parameters
Segment(leftend, rightend) → aPoint(a) → APoint(a) → BPoint(a) → CPoint(a) → DPoint(a) → EPoint(a) → FPoint(a) → GPoint(a) → HPoint(a) → IPoint(a) → JPoint(a) → KPoint(a) → LMeanX(A1) → meanSDX(list1) → sdMin(x(list1)) → bSegment(M, N) → rangePolygon(S, Q, R, T) → poly1, s, q, r, tPolygon(Q, O, P, R) → poly2, q_1, σ_1, p, r_1Mean(deviations) → mdBoxPlot(3, 1, x(A1)) → median
AI Drawing Prompt Reference
Create a dynamic visualization of statistical measures involving multiple points, a line segment, mean line, standard deviation line, minimum value line, range line, data distribution polygon, mean polygon, and box plot. Start by drawing a line segment and generating several points on it. Then, calculate and display the mean, standard deviation, minimum value, and range of these points, using polygons and a box plot to show data distribution and mean, observing the dynamic changes by dragging the points.
The prompt above was compiled from the original drawing commands and is for reference only.