
Statistical Questions Practice
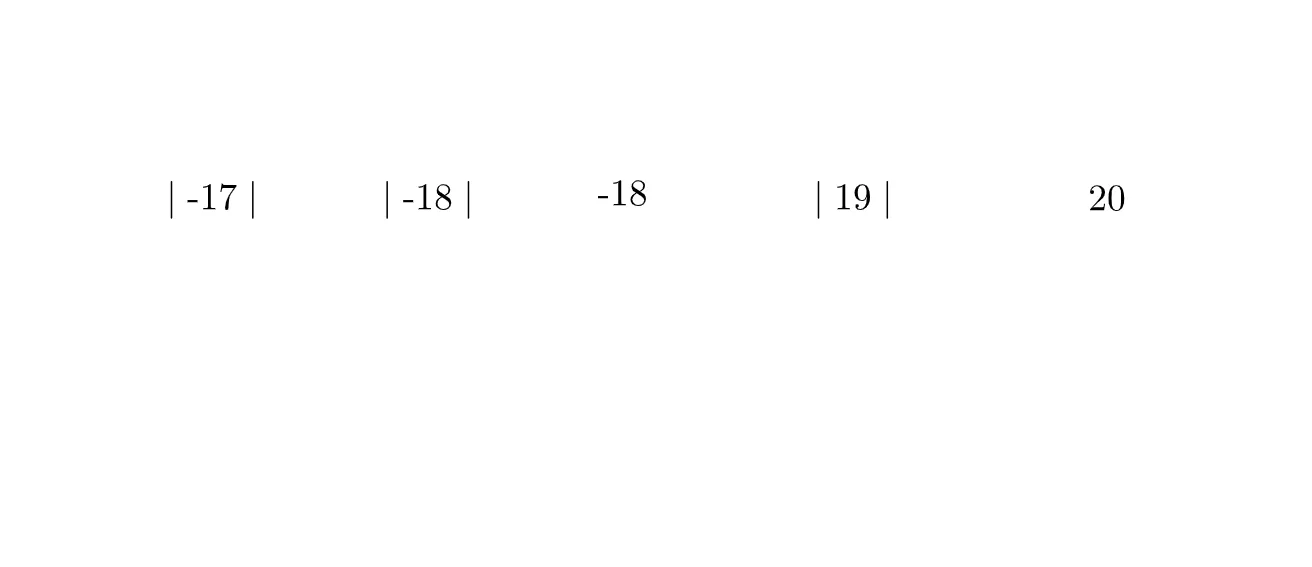
Loading the math board and drawing, please wait…
This example demonstrates how to construct statistical questions using GeoGebra, focusing on data visualization and core concepts like probability & statistics, median value, and arithmetic operations. It utilizes GeoGebra commands/text objects: text1, text2, text3, text4, text5 for annotations. Suitable for upper elementary and middle school statistics education and data analysis practice.
AI Drawing Prompt Reference
Create a graph demonstrating statistical concepts for practice, focusing on data visualization, probability, statistics, median values, and arithmetic operations. Include sliders for interaction, show coordinate geometry relationships, and add text annotations to explain key points and concepts, suitable for middle school statistics education.
The prompt above was compiled from the original drawing commands and is for reference only.