
Filling a Cone Demonstration
Loading the math board and drawing, please wait…
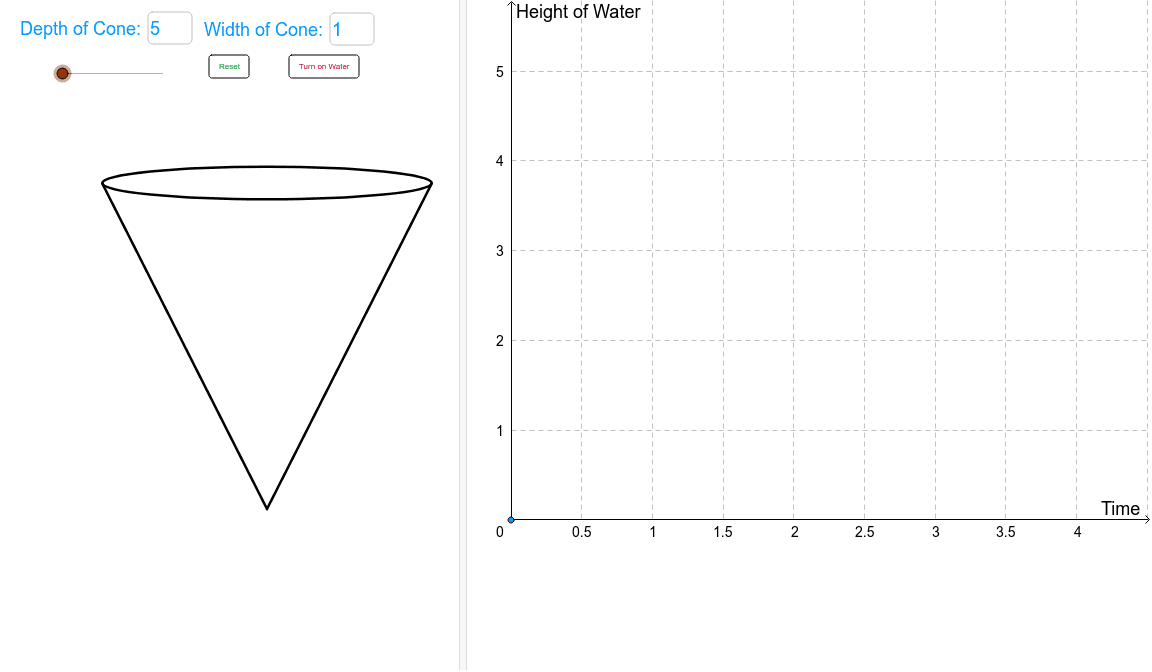
This example demonstrates the dynamic process of volume change in a cone as water height varies. It involves core mathematical concepts like cone volume formula, similar triangles, and linear functions. Constructed using GeoGebra commands such as Tangent, Function, Polygon, and Textfield, with objects like depth, width, and radius. Suitable for high school mathematics education to understand volume calculations and geometric relationships.
GeoGebra Commands & Parameters
Tangent(Apex, top) → a, bFunction(-(x(b) / y(b)) * x - z(b) / y(b), x(Apex) - radius, x(Apex)) → lhsFunction(-(x(a) / y(a)) * x - z(a) / y(a), x(Apex), x(Apex) + radius) → rhsPolygon(Apex, (x(Apex) + wwidth, wheight), (x(Apex) - wwidth, wheight)) → poly1, d, apex, eTextfield(depth) → inputBox1Textfield(width) → inputBox2Textfield(tapwater) → inputBox3Polygon(Apex, (x(Apex) + width / 2, depth), (x(Apex) - width / 2, depth)) → poly2, c, f, g
AI Drawing Prompt Reference
Draw a cone to demonstrate the volume change as water level varies. The cone has a top point and a rectangular base whose width changes with the water level. The water level is represented by a line segment, and as the water level rises, the volume of the cone increases, along with the height and width of the rectangle. Connect the water level and base width with function curves and label the water level, width, and depth in text boxes to observe their relationships.
The prompt above was compiled from the original drawing commands and is for reference only.