
Sine Function by shane molloy
Loading the math board and drawing, please wait…
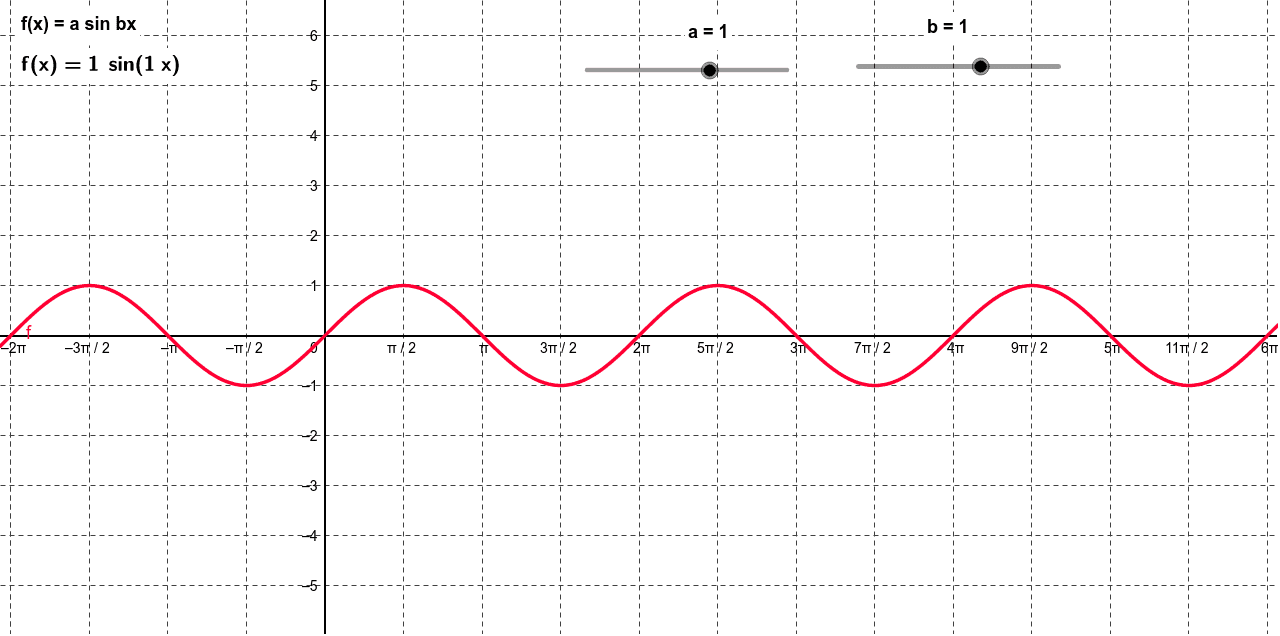
This example demonstrates the graph of the sine function, a type of trigonometric function. The graph shows a periodic wave pattern. Using GeoGebra, we can observe the properties of the sine function, such as periodicity and symmetry. The construction involves function object f and text objects for annotations. Suitable for high school mathematics education and learning.
GeoGebra Commands & Parameters
Numeric a(1.0)Numeric b(1.0)f(x) = (a * sin((b * x)))
AI Drawing Prompt Reference
Draw a sine function graph showing a periodic wave pattern. Include function object and annotation text to describe periodicity and symmetry. Suitable for math education.
The prompt above was compiled from the original drawing commands and is for reference only.