
Field lines in implicit curves
Loading the math board and drawing, please wait…
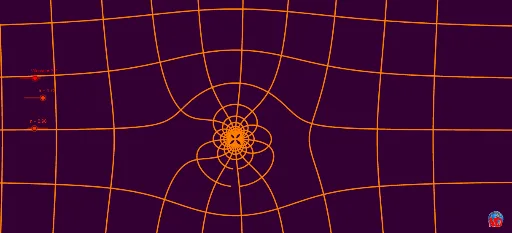
This example demonstrates how to draw field lines on implicit curves in GeoGebra, visually representing the distribution of vector fields. Core mathematical concepts include vector fields, implicit curves, and parametric representation. The construction utilizes GeoGebra commands Sequence and objects such as a (parameter), n (iteration count), liste1, liste2 (lists), image1, image2 (images), and Vitesse (velocity). Suitable for high school and above students studying vector fields, parametric equations, and properties of implicit curves, as well as for mathematical demonstrations and teaching purposes.
GeoGebra Commands & Parameters
Sequence(((y - i) * (x^(2) + y^(2))) = y, i, (-a), a, n) → liste1Sequence(((x - i) * (x^(2) + y^(2))) + x = 0, i, (-a), a, n) → liste2
AI Drawing Prompt Reference
Draw a set of field lines on implicit curves. Choose a parameter range from negative to positive values, and take several equally spaced discrete values. For each value, construct two families of curves: one defined by (y minus the value) times (x squared plus y squared) equals y, and the other by (x minus the value) times (x squared plus y squared) plus x equals zero. Plot all curves on the same coordinate system, showing two interwoven families that reveal the distribution of a vector field. The curves should be smooth and continuous, forming a symmetric pattern that illustrates how the parameter affects their shape.
The prompt above was compiled from the original drawing commands and is for reference only.