
Exponential Function Behavior Demo
Loading the math board and drawing, please wait…
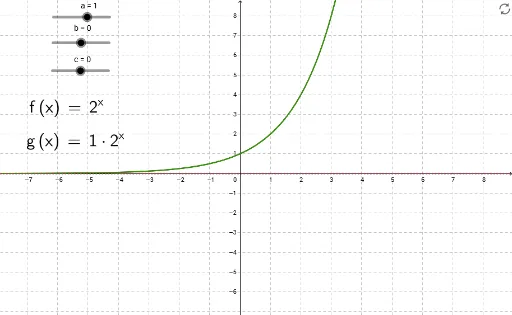
This example demonstrates the behavior of exponential functions f(x)=a^x+c, showing how parameters a and c affect the graph. Key math concepts include exponential function properties, graph transformations, and interactive visualization. Constructed using GeoGebra commands like sliders (a, c), functions (f, g, h), texts, and variables. Ideal for high school mathematics education.
GeoGebra Commands & Parameters
LaTeX(f, true, true) → text1LaTeX(g, true, true) → text2
AI Drawing Prompt Reference
Create a coordinate plane demonstrating exponential function behavior, showing two exponential curves representing different parameter settings. Include two adjustable sliders, one for the base and one for the constant term, to dynamically alter the curves' shape and position. Label each curve with its corresponding mathematical expression in clear formula form. The layout should emphasize how parameter changes affect the graphs, suitable for high school classroom demonstration, with a clean background, clear axes, and distinct curve colors.
The prompt above was compiled from the original drawing commands and is for reference only.