
Ivey Statistics Demo: Integrating Matrices, Quadratic Functions, and Piecewise M
Loading the math board and drawing, please wait…
① This GeoGebra example, titled 'Ivey - Statistics - Demo', demonstrates a comprehensive visualization that merges statistical data handling with multiple mathematical domains, including matrices, quadratic functions, differential equations, special points, and piecewise functions. ② Core mathematical concepts involve statistical analysis, matrix operations, quadratic curve fitting, differential equation modeling, identification of special points (e.g., extrema, intersections), and piecewise-defined functions. ③ Construction highlights: Based on the summary, the example uses a series of point objects (A1 through A8, B1 through B8) likely representing data points or key coordinates, created via GeoGebra commands such as Point, Sequence, or Table; these points are then used to plot scatter plots, fit curves, or define piecewise segments. Matrix commands may be employed for transformations or statistical computations, while differential equation tools (e.g., slope fields or solvers) could be integrated. ④ This resource is suitable for high school to undergraduate statistics and mathematics courses, serving as a dynamic demonstration of multi-concept integration, data visualization, and exploratory learning, ideal for classroom instruction or student self-study.
GeoGebra Commands & Parameters
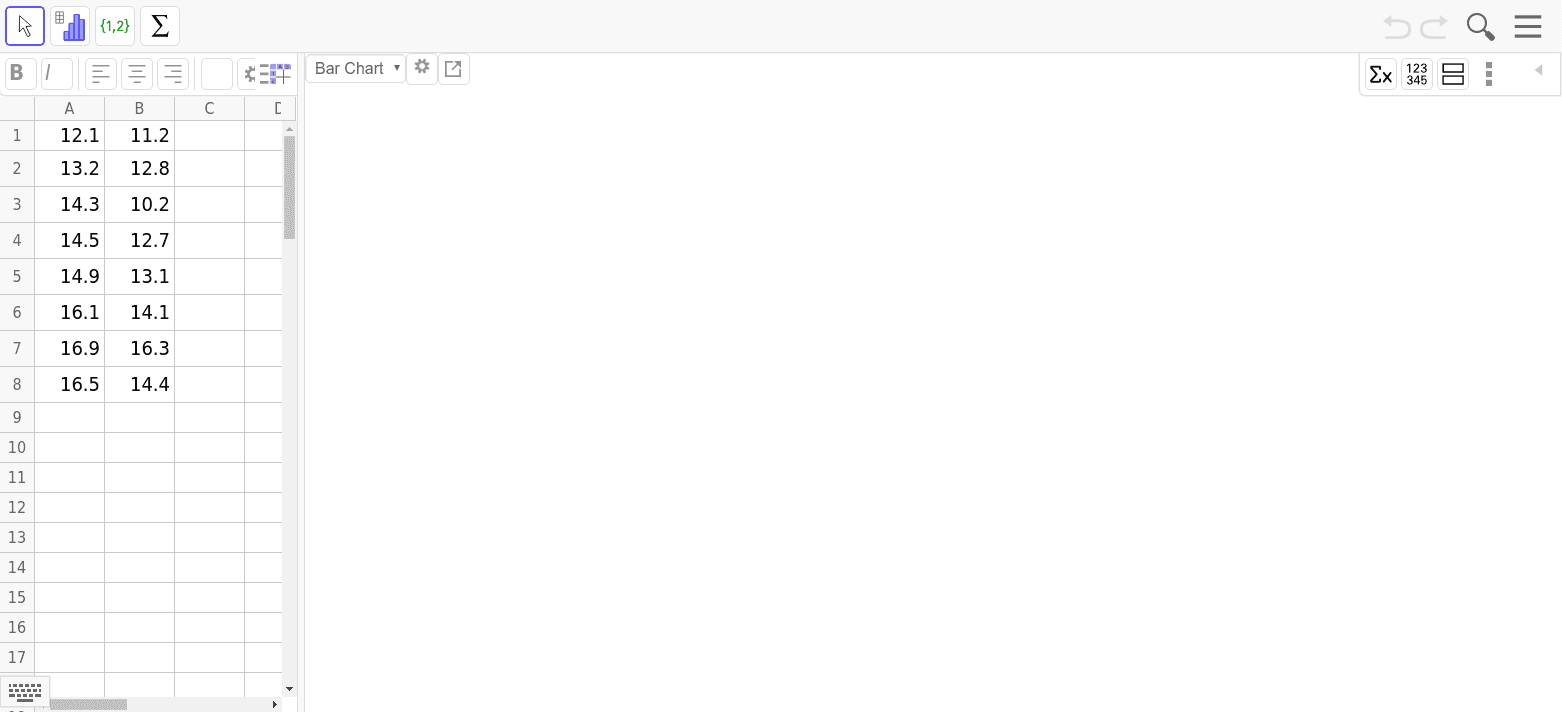
12.113.214.314.514.916.116.911.212.810.212.713.114.116.316.514.4
AI Drawing Prompt Reference
Create a statistical demonstration plot with two sets of eight data points each, marked in different colors. The first set shows an upward trend, while the second is more scattered. Fit a quadratic curve through these points and display its equation. Add a piecewise function composed of two linear segments connecting key points. Use matrix transformations to show rotation or scaling of the data points, and overlay a slope field for a differential equation on the same coordinate plane. Highlight extrema and intersection points with special symbols. Ensure clear axes labels and a layout suitable for classroom teaching.
The prompt above was compiled from the original drawing commands and is for reference only.