
Explore Correlation
Loading the math board and drawing, please wait…
In collections
Geom. & Alg.: Exponential Functions & Logarithms
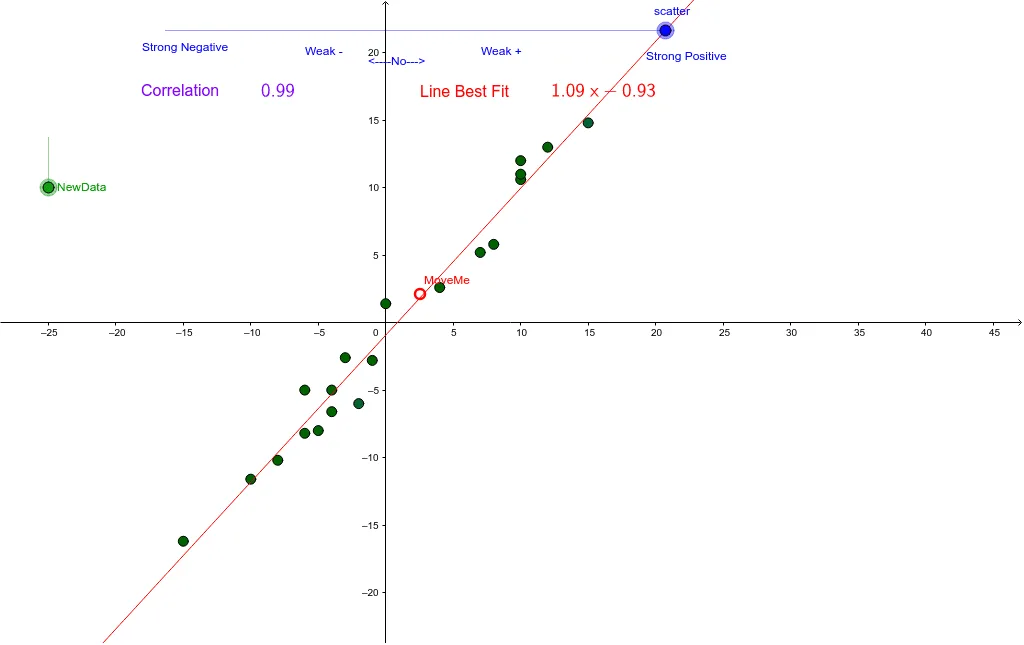
This example demonstrates how to explore the correlation between variables using scatter plots and calculating the Pearson correlation coefficient (PMCC). Key math concepts include correlation, polynomial fitting, matrix transformations, and Poisson distribution. GeoGebra commands like If, Random, FitPoly, PMCC, and LaTeX are used, along with objects such as scatter plot, reciprocal, sliders, and matrices. Suitable for high school and above, focusing on data analysis and statistical modeling fundamentals.
GeoGebra Commands & Parameters
If(scatter ≟ 0, 10.5, 1 / ((5 * scatter))) → recipRandom(-5, 5) → bRandom(-15, 15) → aRandom(-15, 15) → fRandom(-15, 15) → cRandom(-15, 15) → dRandom(-15, 15) → eRandom(-15, 15) → hRandom(-15, 15) → iRandom(-15, 15) → jRandom(-15, 15) → kRandom(-15, 15) → lRandom(-15, 15) → nRandom(-15, 15) → oRandom(-15, 15) → pRandom(-15, 15) → qRandom(-15, 15) → rRandom(-15, 15) → sRandom(-15, 15) → tRandom(-15, 15) → uRandom(-15, 15) → vRandom(-15, 15) → wRandom(0, 1) → sgIf(sg ≟ 0, -1, 1) → plmnFitPoly(Z, 1) → ZZPMCC(Z) → CORRLaTeX(CORR) → text1LaTeX(ZZ) → text4
AI Drawing Prompt Reference
Create a scatter plot to explore the relationship between two variables and calculate the Pearson correlation coefficient. Use randomly generated parameters to observe data distribution through the scatter plot, then fit a polynomial curve, and finally display the value of the correlation coefficient.
The prompt above was compiled from the original drawing commands and is for reference only.