
Horse Race Handicapped
Loading the math board and drawing, please wait…
In collections
Probability & Intro. to Stat.
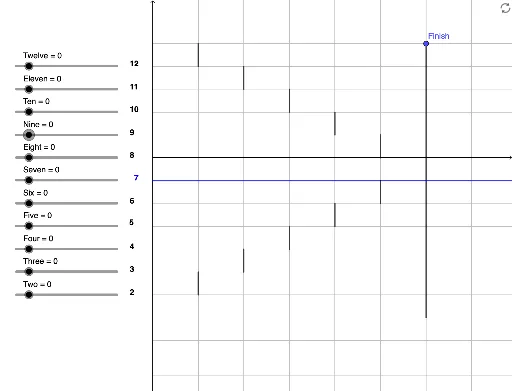
This example demonstrates probability calculations and integral plotting in a dice-based horse race game. Key mathematical concepts include probability statistics, integral calculus, geometric construction, and graphing functions. Construction involves using GeoGebra commands like Segment, Point, and Ray to create race paths, labeling stages with text objects, and animating probability changes with sliders. Suitable for middle to high school mathematics education to understand applications of probability and geometry.
GeoGebra Commands & Parameters
Segment(Finish, B) → fPoint(yAxis) → ARay(A, C) → gPoint(xAxis) → DSegment(D, E) → hSegment(F, G) → iSegment(H, I) → jSegment(J, K) → kSegment(L, M) → lPoint(g) → NSegment(N, O) → mSegment(P, Q) → nSegment(R, S) → pSegment(T, U) → qSegment(V, W) → r
AI Drawing Prompt Reference
Draw a graphical representation of a horse race simulation, including start points, finish points, race track paths, marked points, text labels, and probability change curves. The construction order is to first draw start and finish points, then the race track paths, followed by adding marked points and text labels, and finally drawing the probability change curves. This graph illustrates the application of probability calculations and geometric construction.
The prompt above was compiled from the original drawing commands and is for reference only.