
Two-Tailed T-Test Demo
Loading the math board and drawing, please wait…
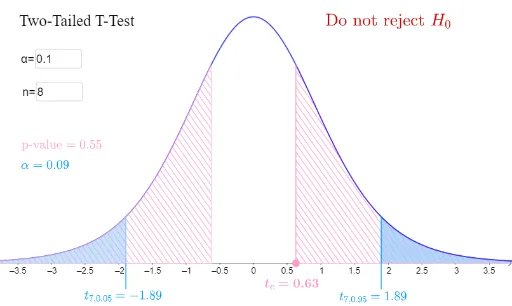
This example demonstrates the process of a two-tailed T-test, including critical regions and P-value calculation. Key math concepts involve hypothesis testing, T-distribution, critical values, and probability computation. GeoGebra commands used include InverseTDistribution for critical value calculation, Segment for region drawing, Integral for P-value, and Textfield for displaying results. Parameters like n, alpha, zsd, zmean are manipulated via sliders for interactive learning, suitable for high school students and beginners in statistics.
GeoGebra Commands & Parameters
InverseTDistribution(n - 1, 1 - alpha / 2) → cvhighInverseTDistribution(n - 1, alpha / 2) → cvlowSegment(Clow, (cvlow, f(cvlow))) → iIntegral(f, cvhigh, Infinity) → aSegment(D, (zxbar, f(zxbar))) → hIntegral(f, zxbar, Infinity) → p1Segment(Chigh, (cvhigh, f(cvlow))) → gIntegral(f, -Infinity, cvlow) → a2Textfield(alpha) → InputBox1Integral(f, -Infinity, zxbar) → p2Integral(f, (-zxbar), Infinity) → p2bIntegral(f, -Infinity, (-zxbar)) → p1aTextfield(n) → InputBox2InverseTDistribution(n - 1, 0.95) → b