
Two-Tailed Z-Test
Loading the math board and drawing, please wait…
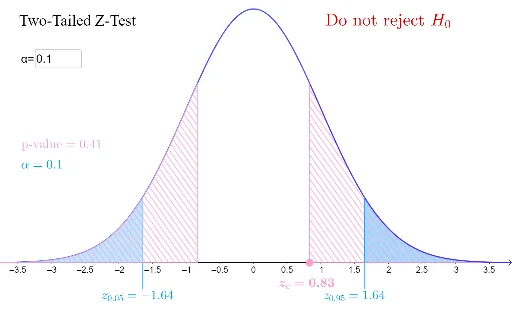
This example demonstrates the process of a two-tailed Z-test. It involves key concepts in hypothesis testing and statistics. Using GeoGebra commands such as InverseNormal, Segment, and Integral, users can visually understand the principles of Z-tests. Suitable for statistics and probability & statistics courses.
GeoGebra Commands & Parameters
InverseNormal(0, 1, 1 - alpha / 2) → cvhighInverseNormal(0, 1, alpha / 2) → cvlowSegment(Clow, (cvlow, f(cvlow))) → iIntegral(f, cvhigh, Infinity) → aSegment(D, (zxbar, f(zxbar))) → hIntegral(f, zxbar, Infinity) → p1Segment(Chigh, (cvhigh, f(cvlow))) → gIntegral(f, -Infinity, cvlow) → a2Textfield(alpha) → InputBox1Integral(f, -Infinity, zxbar) → p2Integral(f, (-zxbar), Infinity) → p2bIntegral(f, -Infinity, (-zxbar)) → p1a
AI Drawing Prompt Reference
Draw a statistical plot demonstrating the process of a two-tailed Z-test, including a normal distribution curve, marking two critical value points, and showing integral areas from the critical values to the curve, as well as the integral area from the sample mean to the curve with corresponding probability values, and finally label the significance level.
The prompt above was compiled from the original drawing commands and is for reference only.