
Standard Deviation Testing
Loading the math board and drawing, please wait…
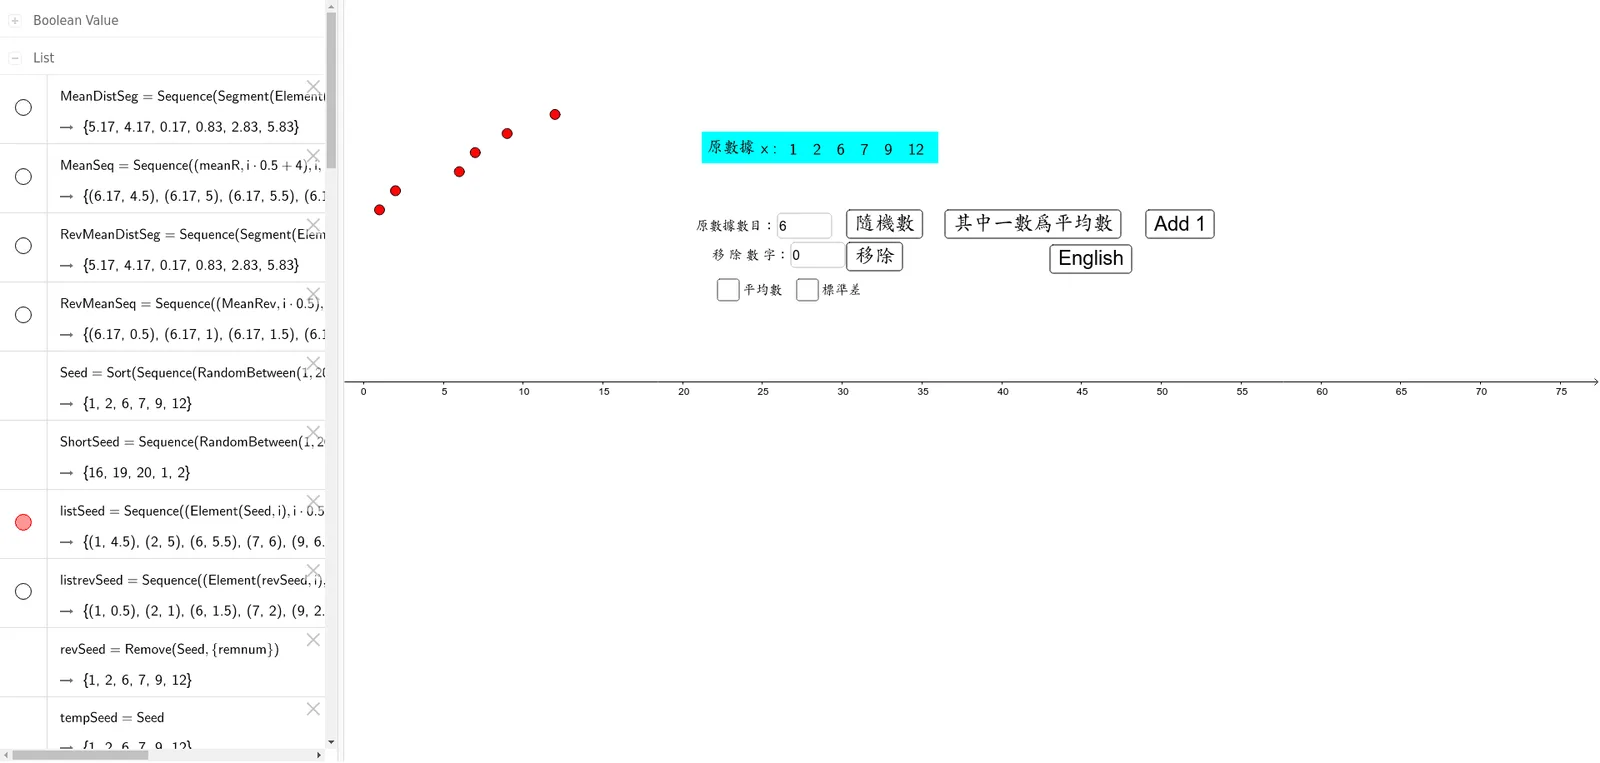
This example demonstrates the calculation and visualization of standard deviation through dynamic data, showcasing its distribution characteristics. Core mathematical concepts include standard deviation, derivatives, logarithms, functions, quadratic equations, and probability & statistics. GeoGebra commands used in construction include Sequence, Sort, mean, stdev, Remove, Segment, Polygon, and LaTeX. Suitable for high school and above mathematics learning, ideal for probability statistics and data analysis instruction.
GeoGebra Commands & Parameters
Sequence(Random[1, 20], i, 1, rannum - 1) → ShortSeedSort(Sequence[Random[1, 20], i, 1, rannum]) → Seedmean(ShortSeed) → MeanSSTextfield(rannum) → InputBox1mean(Seed) → meanRstdev(Seed) → stdRTextfield(remnum) → InputBox2Remove(Seed, {remnum}) → revSeedSequence((Element[Seed, i], (i * 0.5) + 4), i, 1, rannum) → listSeedSequence((meanR, (i * 0.5) + 4), i, 1, rannum) → MeanSeqSequence(Segment[Element[listSeed, i], Element[MeanSeq, i]], i, 1, rannum) → MeanDistSegSequence((Element[revSeed, i], (i * 0.5)), i, 1, rannum) → listrevSeedmean(revSeed) → MeanRevSequence((MeanRev, (i * 0.5)), i, 1, rannum) → RevMeanSeqSegment((meanR, 4.25), (meanR, 4.25 + (rannum * 0.5))) → MeanLineRSequence(Segment[Element[listrevSeed, i], Element[RevMeanSeq, i]], i, 1, rannum) → RevMeanDistSegSegment((MeanRev, 0.25), (MeanRev, (rannum * 0.5) + 0.25)) → RevMeanLinestdev(Seed) → SDRstdev(revSeed) → SDRevPolygon(A, C, D, B) → q1, a_1, c_1, d, b_1Polygon(E, G, H, F) → q2, e_1, g, h, fLaTeX(c_1, true, true) → text8
AI Drawing Prompt Reference
Visualize the calculation and visualization of standard deviation through dynamic data, including randomly generated data points, mean lines, and standard deviation lines, with a slider to dynamically adjust the dataset, different colors to distinguish the original and modified datasets after removing specific data, and highlight key areas using polygons.
The prompt above was compiled from the original drawing commands and is for reference only.