
Introduction to the Normal Distribution
Loading the math board and drawing, please wait…
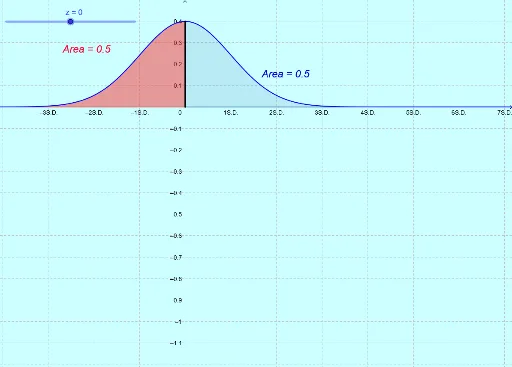
This example demonstrates the graph and properties of the normal distribution. Key math concepts include the normal distribution curve, integral, line segment, and conditional statements. GeoGebra commands used in construction are Integral, Segment, and If, with objects f, z, a, text1, c, S, b, text2. Suitable for high school and above students to learn and understand the normal distribution in probability and statistics.
GeoGebra Commands & Parameters
Integral(f, -10, z) → aSegment((z, 0), (z, f(z))) → cIf(z ≤ 0, (z - 1.8, f(z) - 0.05), (z + 0.3, f(z) - 0.05)) → SIntegral(f, z, 10) → b
AI Drawing Prompt Reference
Draw a normal distribution curve, shade the area under the curve from -10 to z, a vertical segment from z to f(z), and a line segment from (z-1.8, f(z)-0.05) to (z+0.3, f(z)-0.05) when z is less than or equal to 0, and shade the area under the curve from z to 10.
The prompt above was compiled from the original drawing commands and is for reference only.