
Behavior of Rational Functions: Zeros, Poles, and Asymptotes
Loading the math board and drawing, please wait…
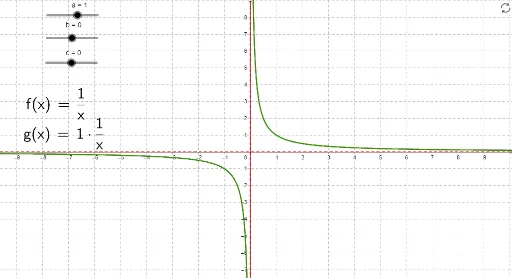
① This GeoGebra example dynamically illustrates the behavior of rational functions (e.g., f(x)=a(x-b)/(x-c)), focusing on how the graph changes near zeros, vertical asymptotes, and horizontal asymptotes. ② Core mathematical concepts include rational functions, zeros (where numerator equals zero), poles (where denominator equals zero causing vertical asymptotes), horizontal asymptotes (as x tends to infinity), and discontinuities in the graph. ③ Construction details: Based on the summary, LaTeX commands are used for mathematical expressions, with objects b, a, c, f, text1, g, text2, h, and eq1 defined. Functions f and g likely represent the rational expressions, text1 and text2 are labels, and eq1 is an equation object. Parameters a, b, c can be adjusted via sliders to dynamically change coefficients and observe graph transformations. ④ Suitable for high school or pre-calculus students learning function properties, limits, and asymptotes, as well as for teachers to demonstrate rational function behavior in class.
GeoGebra Commands & Parameters
LaTeX(f, true, true) → text1LaTeX(g, true, true) → text2
AI Drawing Prompt Reference
Draw a rational function f(x)=a(x-b)/(x-c) with adjustable parameters a, b, and c. Show the graphs of f(x) and another rational function g(x), and label the zeros, vertical asymptotes, and horizontal asymptotes of f(x). Use text to describe these key points.
The prompt above was compiled from the original drawing commands and is for reference only.