
Epsilon-Delta Visualization of Finite Limit and Continuity
Loading the math board and drawing, please wait…
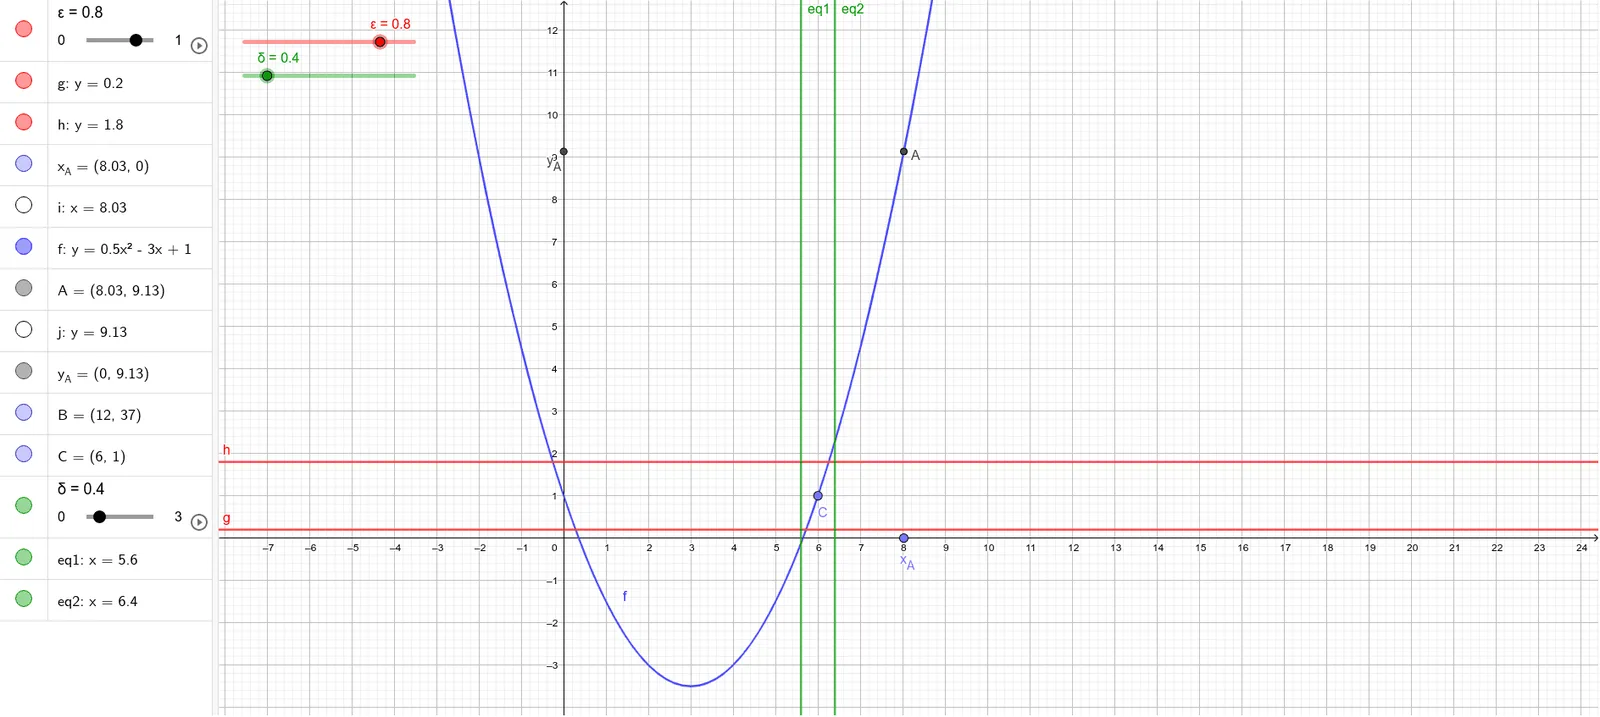
This GeoGebra example provides an interactive visualization of the epsilon-delta definition of a finite limit and continuity of a function. It demonstrates that for any given positive epsilon, there exists a positive delta such that if the distance between x and the target point x_A is less than delta, then the distance between f(x) and the limit value is less than epsilon. The core concepts include the rigorous definition of limits, continuity, neighborhoods, and the epsilon-delta logic. The construction uses GeoGebra commands such as Point to create key points A, B, C, OrthogonalLine to draw perpendicular lines representing the epsilon and delta bands, and Intersect to find intersection points. Objects like epsilon, g, h, x_A, i, f, A, j, y_A, B, C, delta, eq1, eq2 are defined, allowing users to adjust epsilon and delta via sliders or inputs and observe how the function graph relates to the bands. This is suitable for university-level calculus or advanced high school mathematics, helping students grasp the formal definition of limits and continuity through dynamic exploration.
GeoGebra Commands & Parameters
Point(xAxis) → x_AOrthogonalLine(x_A, xAxis) → iIntersect(f, i) → A,OrthogonalLine(A, yAxis) → jIntersect(j, yAxis) → y_APoint(f) → BPoint(f) → C
AI Drawing Prompt Reference
Create an epsilon–delta style visualization for a finite limit/continuity definition. Start by choosing a target x-coordinate point on the horizontal axis, then draw the vertical line through it. Intersect this vertical line with the function graph to obtain the key point A. Next, construct a vertical auxiliary line through A and intersect it with the vertical axis to determine the limit y-coordinate point y_A. Also place two additional points on the function graph, labeled B and C, as function samples. Arrange the elements so the geometry reflects that when x is close to the target point x_A, the corresponding f(x) is close to the limit value y_A, suitable for later epsilon–delta band comparisons.
The prompt above was compiled from the original drawing commands and is for reference only.