
Limit Behavior of a Polynomial Function Near a Cluster Point
Loading the math board and drawing, please wait…
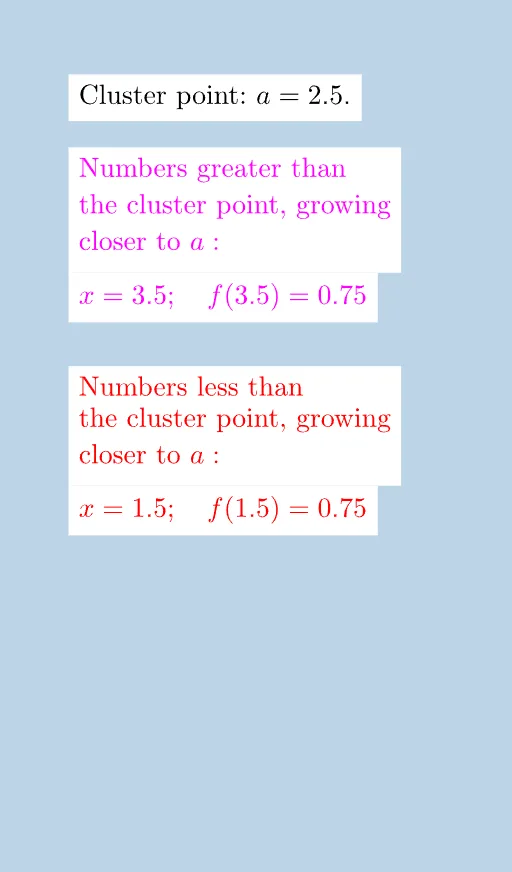
① This applet dynamically illustrates how the values of a polynomial function behave as the independent variable approaches a cluster point, providing an intuitive visualization of the concept of a limit. ② Core mathematical concepts include limits, cluster points, continuity of polynomial functions, and the process of function values approaching a target. ③ Construction highlights: using GeoGebra commands Point and Segment, the applet creates objects A, i, f, B, g, P, P', h, j, k, C, p, Q, Q', l, m, along with coordinate variables y_P, y_Q, x_P, x_Q and multiple text objects (texto1 to texto11) to label values and explanations, with dynamic points P and Q showing the variation of function values. ④ Suitable for high school seniors or early university students learning calculus, ideal for classroom demonstrations or self-study of limits, and useful as a reference for teachers creating interactive limit lessons.
GeoGebra Commands & Parameters
Point(xAxis) → ASegment((x(A) - 1, 0), A) → iPoint(i) → BSegment(P, P') → hSegment(B, P) → jSegment(A, (x(A) + 1, 0)) → kPoint(k) → CSegment(C, Q) → lSegment(Q, Q') → m
AI Drawing Prompt Reference
Draw a graph of a polynomial function and dynamically show how the function values behave as the independent variable approaches a cluster point. Start by creating a point A on the x-axis, then draw a horizontal segment i through A. Next, create a point B on i and draw line segments h and j through A and B. Create a point C on the x-axis and draw line segments l and m through C and Q to illustrate the variation of function values.
The prompt above was compiled from the original drawing commands and is for reference only.