
Limit of a Constant Function at a Cluster Point
Loading the math board and drawing, please wait…
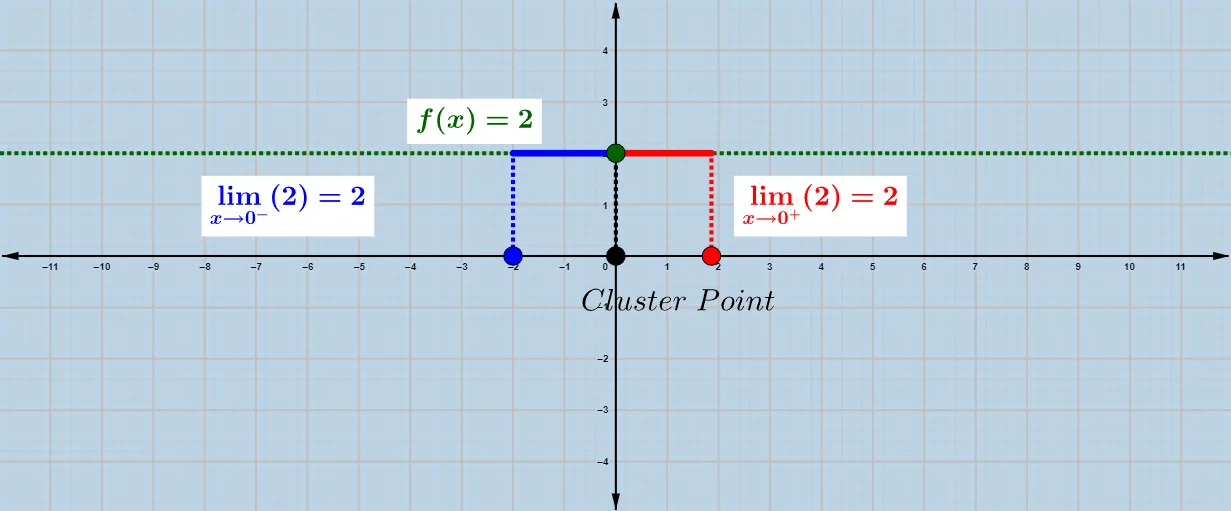
This example uses an interactive graph to illustrate how a constant function behaves around a cluster point: as the input approaches the accumulation point, the function values stay equal to the same constant. It is designed to build intuition for the formal definition of limits in a neighborhood of a cluster point. The key mathematical concepts include the limit of a function, one-sided limit behavior (via LimitBelow/Limit), and the graphical meaning that a constant function’s limit equals its constant value. Construction-wise, the applet creates geometric primitives such as points and segments (Point, Segment), introduces the relevant neighborhood/approach point (ClusterPoint), and computes/labels the limiting value using Limit and LimitBelow (including objects like leftlimit and Limit). Visual/text objects (texto1–texto3) and supporting function/trace objects (e.g., g, h, and related points) are used to display the approach direction and confirm the constant limit. Suitable for calculus lessons and for students learning the first intuition of limits from function graphs.
GeoGebra Commands & Parameters
Point(yAxis) → KPoint(xAxis) → ClusterPointSegment((x(ClusterPoint) - 2, 0), ClusterPoint) → gSegment(ClusterPoint, (x(ClusterPoint + 2), 0)) → hPoint(g) → APoint(h) → BLimitBelow(f, x(ClusterPoint)) → leftlimitLimit(f, a) → LSegment(A, (x(A), f(x(A)))) → iSegment(B, (x(B), f(x(B)))) → jSegment(ClusterPoint, (x(ClusterPoint), f(x(ClusterPoint)))) → k
AI Drawing Prompt Reference
Draw a diagram illustrating a constant function near a cluster point. The diagram should include a horizontal line segment representing constant function values, a cluster point marker above the line, two horizontal line segments from the cluster point showing function values on both sides, and a horizontal line segment connecting the cluster point to the constant value. The overall diagram should clearly show the function's behavior near the cluster point, with values remaining constant.
The prompt above was compiled from the original drawing commands and is for reference only.