
Derivative as a Rate of Change (GeoGebra Applet)
Loading the math board and drawing, please wait…
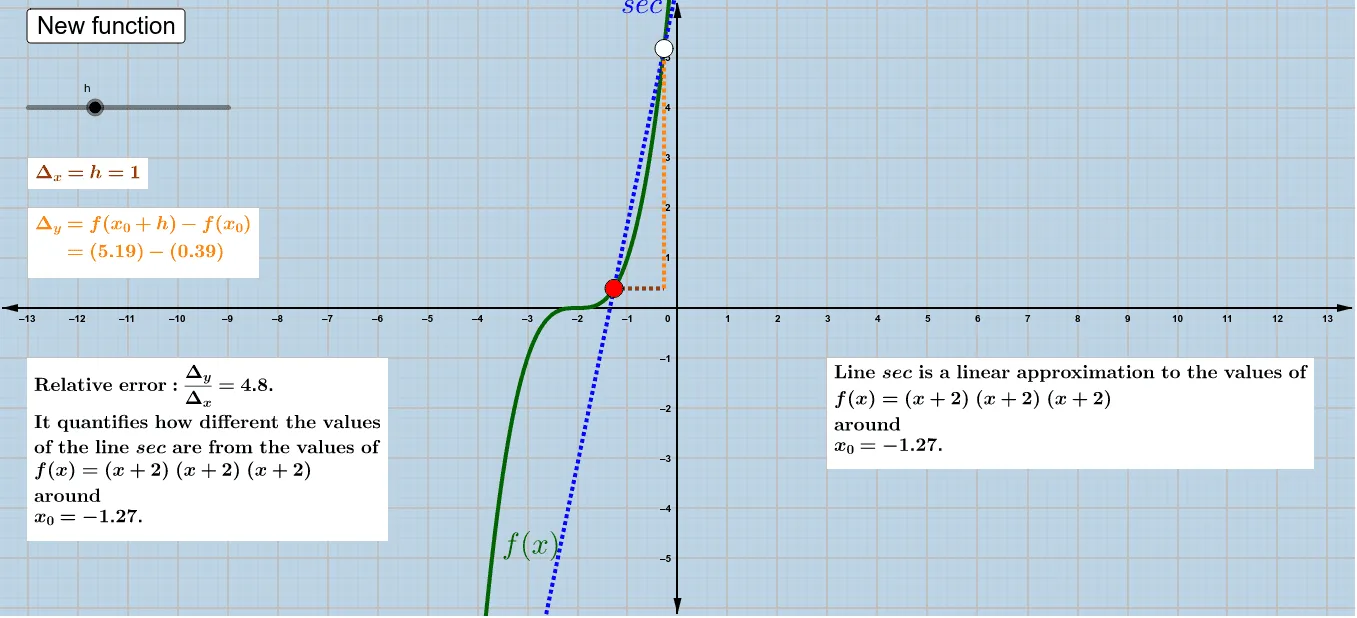
This GeoGebra applet provides a dynamic visualization of the derivative as a rate of change. It illustrates how the slope of the tangent line to a polynomial function varies as the point of tangency moves along the curve. The construction uses commands such as Random, Point, Tangent, Line, OrthogonalLine, Intersect, Segment, and Slope to generate interactive points, tangents, and slope segments. Users can drag the point of tangency to observe how the derivative value changes in real time. It is suitable for high school calculus courses, undergraduate introductory mathematics, and independent study of differential calculus concepts.
GeoGebra Commands & Parameters
Random(-2, 2) → aRandom(-2, 2) → cRandom(-2, 2) → bPoint(f) → ATangent(A, f) → gLine(B, A) → lOrthogonalLine(B, yAxis) → iOrthogonalLine(A, yAxis) → jOrthogonalLine(A, xAxis) → kOrthogonalLine(B, xAxis) → mIntersect(j, m) → CSegment(A, C) → nSegment(C, B) → pSlope(g) → m_1