
Exploring Graphs of Quadratic Functions
Loading the math board and drawing, please wait…
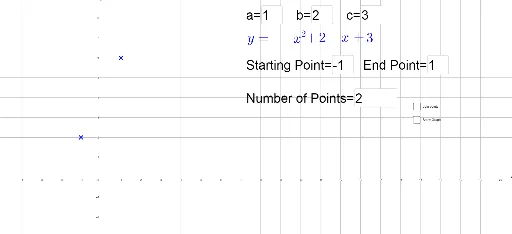
This GeoGebra example dynamically illustrates the graphs of quadratic functions, allowing users to adjust parameters in real time via input boxes and sliders to observe translations, dilations, and reflections of the parabola. Core mathematical concepts include the standard form of quadratic functions, vertex and axis of symmetry, as well as connections to right triangles, similar triangles, and sine functions. The construction uses Textfield and Sequence commands to create multiple input boxes and sequence objects, with parameters a, b, c, d, e controlling the function coefficients, and list1 and line l1 aiding in displaying key points and geometric relationships. It is suitable for middle and high school students learning function transformations, coordinate geometry, and visual reasoning, either for classroom demonstration or self-guided exploration, helping to understand how parameter changes affect the graph and the interplay between functions and geometry.
GeoGebra Commands & Parameters
Textfield(a) → InputBox1Textfield(b) → InputBox2Textfield(c) → InputBox3Textfield(d) → InputBox4Textfield(e) → InputBox5Textfield(g) → InputBox6Sequence((d + (m * (e - d) / (g - 1)), (a * (d + (m * (e - d) / (g - 1)))^(2)) + (b * (d + (m * (e - d) / (g - 1)))) + c), m, 0, g - 1) → list1Sequence(Segment[list1(m), list1(m + 1)], m, 1, g - 1) → l1
AI Drawing Prompt Reference
Create a dynamic quadratic function graph where the coefficients are controlled by five input boxes, corresponding to the quadratic term, linear term, constant term, and the start and end points of the x-range. In the coordinate system, generate a series of discrete points evenly spaced between the start and end points, with the number of points determined by another input box. Connect these points sequentially with line segments to form a polyline approximating the parabola. Also display the key points and coordinate axes, allowing observation of translations, dilations, and reflections as parameters change.
The prompt above was compiled from the original drawing commands and is for reference only.