
Quiz: Graphing Logarithmic Functions (Includes Transformations)
Loading the math board and drawing, please wait…
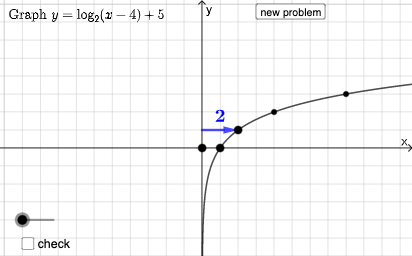
This interactive quiz demonstrates graphing logarithmic functions y=logₐ(x-b)+c and their transformations. Key mathematical concepts include domain/range of logarithmic functions, monotonicity, and geometric transformations (translations, stretches). Construction highlights: Uses Point and Intersect commands to locate key points, If statements for answer validation, Random and RandomElement for generating varied problems, sliders to control parameters a, b, c showing dynamic transformations, and text objects for questions and feedback. Suitable for high school math students learning functions, particularly as practice or assessment in exponential and logarithmic function units.
GeoGebra Commands & Parameters
Point(Ray[B + (1, 1), B + (2, 1)]) → CPoint(Ray[B + (1, -1), B + (2, -1)]) → DIntersect(xAxis, yAxis) → GVector(G, A) → uVector(H, B) → vIntersect(eq1, y = y(C)) → IIntersect(eq1, y = y(D)) → JVector(I, C) → wVector(J, D) → jRandom(-5, 5) → lRandom(-5, 5) → mRandomElement({2, 3, 4, 5, 6}) → bbRandom(-5, 5) → nRandom(0, 1) → ggIf(gg ≟ 0, log(bb, x - m) + 5, (-log(bb, x - m)) + 5) → qIf(gg ≟ 0, f ≟ q, p ≟ q) → o
AI Drawing Prompt Reference
Draw the graph of the function y=logₐ(x-b)+c, where a is a random integer between 2 and 6, and b and c are random integers between -5 and 5. Start by drawing the x-axis and y-axis, then find key points C and D. Draw lines through points C and D, and use their intersections with the y-axis to determine the function's graph. Finally, draw the function's graph based on the random parameters, and decide whether to draw the positive or negative logarithmic function based on a random number.
The prompt above was compiled from the original drawing commands and is for reference only.