
Exploring Exponential Functions by Lew W. S.
Loading the math board and drawing, please wait…
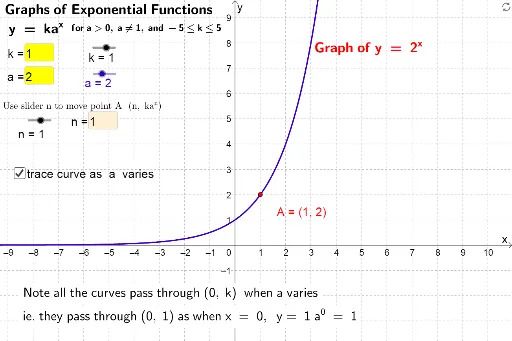
This example demonstrates the changes in the graph of the exponential function f(x) = a^x by adjusting parameters a and k. Key concepts include exponential functions, function graphs, and parametric equations. GeoGebra commands used include Textfield, InputBox, and function graphing. Suitable for high school math education and learning.
GeoGebra Commands & Parameters
Textfield(k) → InputBox1Textfield(a) → InputBox2Textfield(n) → InputBox3
AI Drawing Prompt Reference
Draw the graph of the exponential function f(x) = a^x, where a and k are adjustable parameters. First input the value of a, then input the value of k, and finally input the value of n. Based on the input values of a and k, draw the corresponding exponential function graph.
The prompt above was compiled from the original drawing commands and is for reference only.