
Equivalent Fractions Demo by My Geometry Resources
Loading the math board and drawing, please wait…
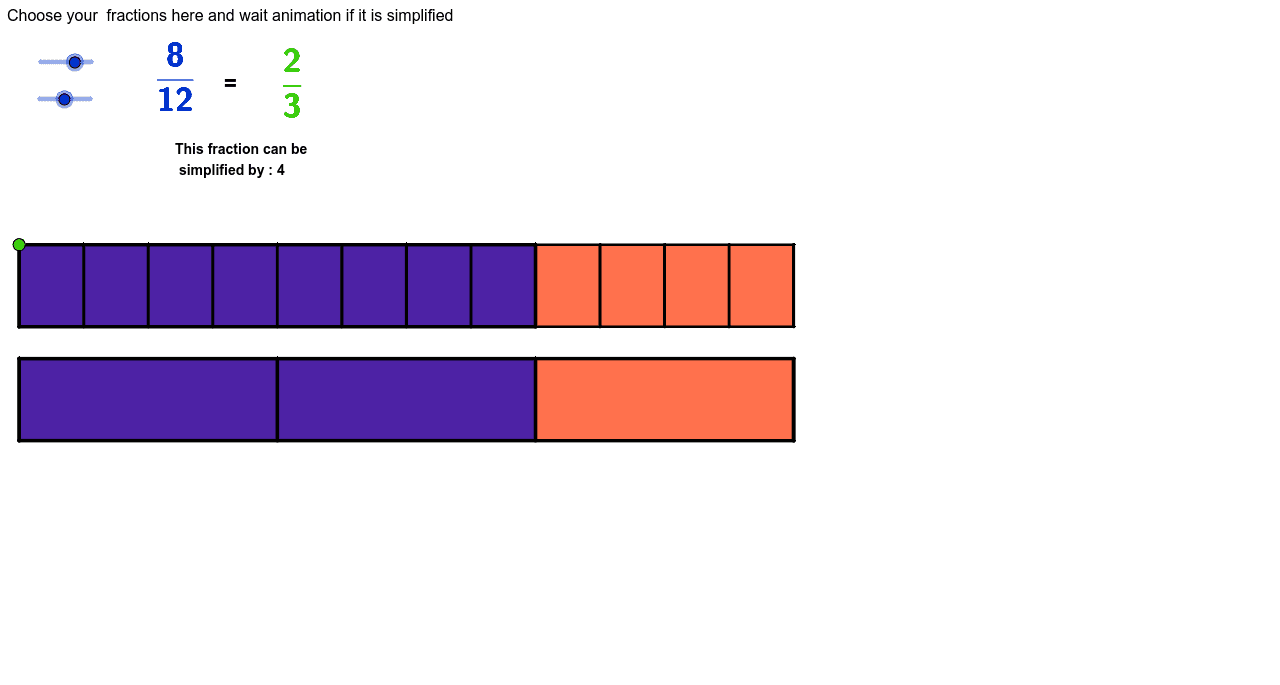
This example visually demonstrates the concept of equivalent fractions, showcasing fraction equivalence through graphical segmentation and numerical comparison. Core math concepts include fractions, Greatest Common Divisor (GCD), geometric segmentation, and proportional relationships. Construction highlights the use of GeoGebra commands/objects like GCD, Segment, RandomNormal, RandomBinomial, Binomial, Sequence, Polygon, Line, If, with objects such as n_1, d_1, h, t, A, B, C, etc., to achieve dynamic fraction representation and geometric validation. Suitable for middle school and above mathematics education, aiding in fraction comprehension and geometric intuition development.
GeoGebra Commands & Parameters
GCD(n_1, d_1) → hSegment(A, B) → aRandomNormal(2, 4) → cRandomBinomial(2, 3) → bBinomial(4, 2) → dSequence((x(D) + (i * a / d_1), y(D)), i, 0, d_1) → PointbasSequence((x(A) + (i * a / d_1), y(A)), i, 0, d_1) → PointhautSequence(Segment[Element[Pointhaut, i], Element[Pointbas, i]], i, 1, d_1 + 1) → liste1Polygon(A, B, C, D) → Total, a_2, b_1, c_1, d_4Polygon(A, D, Element[Pointbas, n_1 + 1], Element[Pointhaut, n_1 + 1]) → Morceau, a_1, d_3, i, jPolygon(E, F, H, G) → poly1, e, f_1, h_1, g_1Sequence((x(G) + (i * e / (d_1 / h)), y(G)), i, 0, d_1 / h) → L2Sequence((x(E) + (i * e / (d_1 / h)), y(E)), i, 0, d_1 / h) → L3Sequence(Segment[Element[L3, i], Element[L2, i]], i, 1, d_1 / h + 1) → liste2Polygon(E, G, Element[L2, n_1 / h + 1], Element[L3, n_1 / h + 1]) → poly2, e_1, g, f, kLine(A, yAxis) → lIf((h * h) ≟ 1, 0, 5) → Vitesse
AI Drawing Prompt Reference
Create a visual demonstration of equivalent fractions using graphical segmentation and numerical comparison. Start by drawing a rectangle and dividing it into several equal parts, highlighting different sections with different colors to represent various fractions. Then, create a coordinate system next to it, plot points to represent equivalent fractions, and connect them with lines to show the relationships. Add dynamic elements like sliders and randomly generated points to enhance the demonstration.
The prompt above was compiled from the original drawing commands and is for reference only.