
Equations from Tables
Loading the math board and drawing, please wait…
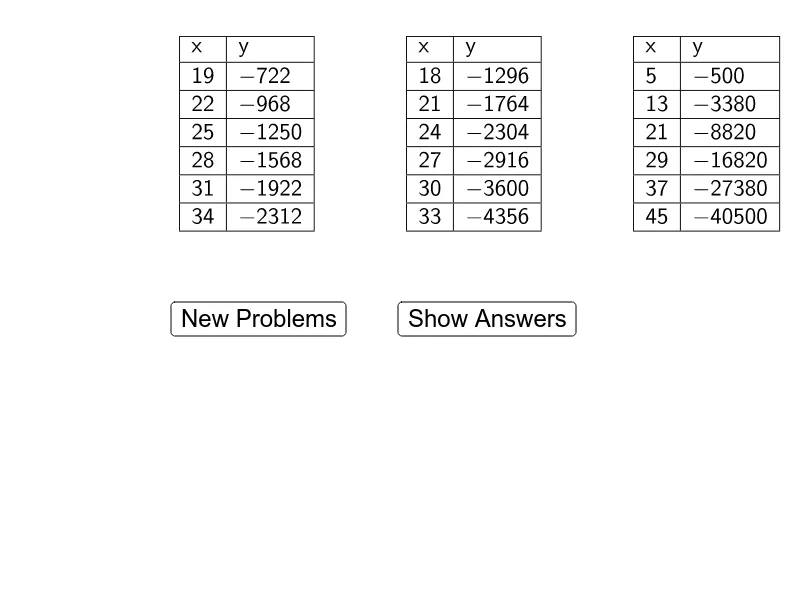
This example demonstrates how to transform table data into linear function equations using GeoGebra. Core math concepts include equation representation, division, and linear functions. Construction highlights involve commands like Sequence, Sort, Random, Element, Join, FractionText, If, TableText, and objects such as button1, list2, list1, coefs, A1, startingX1, A2, intervalX1, A3, A4, A5, A6, coef1, A7, coef2, coef3, coef4, coef5, b2, b3, b4, b5, coef6, b, b6, b1, B2, B3, B4, B5, B6, B7, D1, startingX2, D2, intervalX2, D3, D4, D5, D6. Suitable for middle school and above students to understand the relationship between data and functions, and to master equation construction techniques.
GeoGebra Commands & Parameters
Sequence(i, i, 1, 20) → list2Sequence((-i), i, 1, 20) → list1Sort(Join[{list1, list2}]) → coefsRandom(0, 20) → startingX1Random(0, 10) → intervalX1Element(coefs, Random[1, 20]) → coef1Element(coefs, Random[1, 20]) → coef2Element(coefs, Random[1, 20]) → coef3Element(coefs, Random[1, 20]) → coef4Element(coefs, Random[1, 20]) → coef5Element(coefs, Random[1, 20]) → coef6Join({list1, list2, {0}}) → bFractionText((coef1 * A2^(2)) + b1) → B2FractionText((coef1 * A3^(2)) + b1) → B3FractionText((coef1 * A4^(2)) + b1) → B4FractionText((coef1 * A5^(2)) + b1) → B5FractionText((coef1 * A6^(2)) + b1) → B6FractionText((coef1 * A7^(2)) + b1) → B7Random(0, 20) → startingX2Random(0, 10) → intervalX2FractionText((coef2 * D2^(2)) + b2) → E2FractionText((coef2 * D3^(2)) + b2) → E3FractionText((coef2 * D4^(2)) + b2) → E4FractionText((coef2 * D5^(2)) + b2) → E5FractionText((coef2 * D6^(2)) + b2) → E6FractionText((coef2 * D7^(2)) + b2) → E7Random(0, 20) → startingX3Random(0, 10) → intervalX3FractionText((coef3 * G2^(2)) + b3) → H2FractionText((coef3 * G3^(2)) + b3) → H3FractionText((coef3 * G4^(2)) + b3) → H4FractionText((coef3 * G5^(2)) + b3) → H5FractionText((coef3 * G6^(2)) + b3) → H6FractionText((coef3 * G7^(2)) + b3) → H7Random(0, 20) → startingX4Random(0, 10) → intervalX4FractionText((coef4 * J2^(2)) + b4) → K2FractionText((coef4 * J3^(2)) + b4) → K3FractionText((coef4 * J4^(2)) + b4) → K4FractionText((coef4 * J5^(2)) + b4) → K5FractionText((coef4 * J6^(2)) + b4) → K6FractionText((coef4 * J7^(2)) + b4) → K7Random(0, 20) → startingX5Random(0, 10) → intervalX5FractionText((coef5 * M2^(2)) + b5) → N2FractionText((coef5 * M3^(2)) + b5) → N3FractionText((coef5 * M4^(2)) + b5) → N4FractionText((coef5 * M5^(2)) + b5) → N5FractionText((coef5 * M6^(2)) + b5) → N6FractionText((coef5 * M7^(2)) + b5) → N7Random(0, 20) → startingX6Random(0, 10) → intervalX6FractionText((coef6 * P2^(2)) + b6) → Q2FractionText((coef6 * P3^(2)) + b6) → Q3FractionText((coef6 * P4^(2)) + b6) → Q4FractionText((coef6 * P5^(2)) + b6) → Q5FractionText((coef6 * P6^(2)) + b6) → Q6FractionText((coef6 * P7^(2)) + b6) → Q7If(b1 < 0, (-b1), b1) → forTextb1If(b2 < 0, (-b2), b2) → forTextb2If(b3 < 0, (-b3), b3) → forTextb3If(b4 < 0, (-b4), b4) → forTextb4If(b5 < 0, (-b5), b5) → forTextb5If(b6 < 0, (-b6), b6) → forTextb6If(b1 < 0, " - ", " + ") → sign1If(b2 < 0, " - ", " + ") → sign2If(b3 < 0, " - ", " + ") → sign3If(b4 < 0, " - ", " + ") → sign4If(b5 < 0, " - ", " + ") → sign5If(b6 < 0, " - ", " + ") → sign6If(showAnswers ≟ true, (("y = " * coef1) * "x²"), "y") → yText1If(showAnswers ≟ true, (("y = " * coef2) * "x²"), "y") → yText2If(showAnswers ≟ true, (("y = " * coef3) * "x²"), "y") → yText3If(showAnswers ≟ true, (("y = " * coef4) * "x²"), "y") → yText4If(showAnswers ≟ true, (("y = " * coef5) * "x²"), "y") → yText5If(showAnswers ≟ true, (("y = " * coef6) * "x²"), "y") → yText6TableText({{A1, B1}, {A2, B2}, {A3, B3}, {A4, B4}, {A5, B5}, {A6, B6}, {A7, B7}}, "|_") → Table1TableText({{D1, E1}, {D2, E2}, {D3, E3}, {D4, E4}, {D5, E5}, {D6, E6}, {D7, E7}}, "|_") → Table2TableText({{G1, H1}, {G2, H2}, {G3, H3}, {G4, H4}, {G5, H5}, {G6, H6}, {G7, H7}}, "|_") → Table3TableText({{J1, K1}, {J2, K2}, {J3, K3}, {J4, K4}, {J5, K5}, {J6, K6}, {J7, K7}}, "|_") → Table4TableText({{M1, N1}, {M2, N2}, {M3, N3}, {M4, N4}, {M5, N5}, {M6, N6}, {M7, N7}}, "|_") → Table5TableText({{P1, Q1}, {P2, Q2}, {P3, Q3}, {P4, Q4}, {P5, Q5}, {P6, Q6}, {P7, Q7}}, "|_") → Table6
AI Drawing Prompt Reference
Create a graph showing how to transform table data into linear function equations. Generate two sets of symmetric data, sort them, and randomly select coefficients to form multiple linear function graphs. Each function is displayed in a different color with marked points, highlighting the relationship between the function images and data points to illustrate the construction process of function equations.
The prompt above was compiled from the original drawing commands and is for reference only.