
Quadratic Function Nomogram
Loading the math board and drawing, please wait…
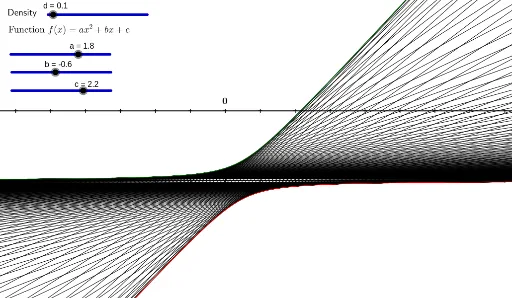
This example demonstrates the nomogram of quadratic functions and how changes in parameters a, b, c affect the graph's shape, vertex, and axis of symmetry. It involves core math concepts like quadratic functions and their properties. Constructed using GeoGebra commands like Sequence and objects such as sliders, text, and lists to visualize dynamic changes. Suitable for high school mathematics education to explore quadratic function characteristics and parameter significance.
GeoGebra Commands & Parameters
Sequence((i, -1), i, -10, 10, 1) → L_1Sequence((i, 1), i, -10, 10, 1) → L_2Sequence(Line[(i, -1), (h(i), 1)], i, -20, 20, d) → list1