
Lipschitz Continuity Geometric Demo
Loading the math board and drawing, please wait…
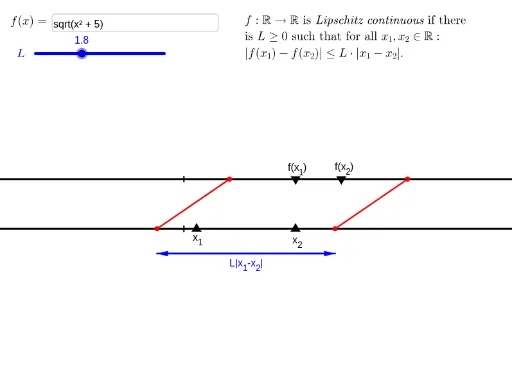
This example demonstrates the geometric meaning of Lipschitz continuity through interactive graphics, showing that the ratio of distances between any two points on the function's graph to their corresponding independent variable differences is bounded. Key mathematical concepts include continuity, Lipschitz condition, vector and distance calculations. It uses commands like Point, Textfield, Intersect, Segment, Vector to construct function graphs, points, vectors, and segments. Suitable for high school and above learners to intuitively understand the abstract definition of Lipschitz continuity and its applications.
GeoGebra Commands & Parameters
Point(f) → APoint(f) → BTextfield(h) → InputBox1Intersect(yAxis, g) → EIntersect(f, yAxis) → FSegment(H, J) → iSegment(G, I) → jVector(M, K) → uVector(K, M) → v
AI Drawing Prompt Reference
Draw the graph of a function f and select two points A and B on it. Input a function g and find its intersection with the y-axis at point E, and the intersection of f with the y-axis at point F. Draw line segment EF, then draw line segment AB. Finally, select points H and J and draw vectors u and v.
The prompt above was compiled from the original drawing commands and is for reference only.