
Distribution of Primes 2: Prime Point Grid Visualization
Loading the math board and drawing, please wait…
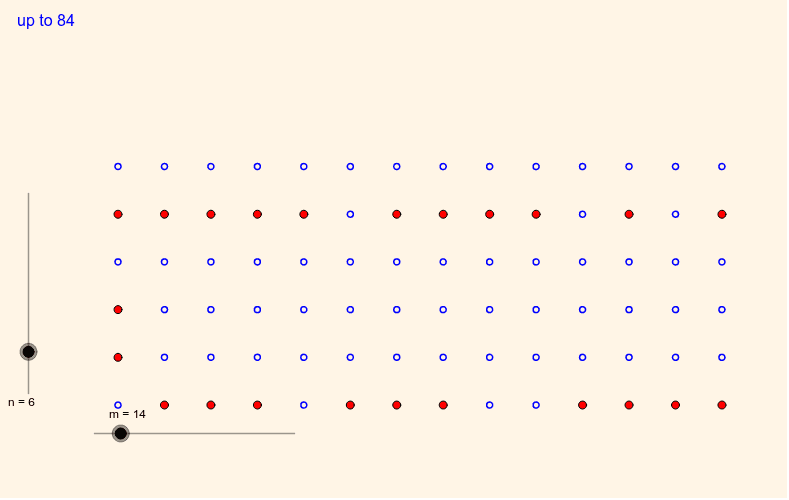
① This example visualizes how prime numbers are distributed among positive integers by mapping them onto a square grid, highlighting prime positions to reveal patterns. ② Core mathematical concepts include prime numbers, distribution properties (e.g., intuitive sense of the prime number theorem), sequences, sets, and coordinate mapping. ③ Construction details: Uses GeoGebra commands Sequence (to generate number sequences) and Max (to control grid bounds); objects include m, n (grid dimensions), list1 (prime list), win (window), list2 and list3 (coordinate or marker lists), text1 (text labels), a and b (auxiliary parameters). The mapping assigns each integer to a grid cell and marks primes distinctly. ④ Suitable for high school and above, useful for number theory introduction, observing prime density, and as a math-computing experiment.
GeoGebra Commands & Parameters
Sequence((Div[i, n] + 1, Mod[i, n] + 1), i, 0, (n * m) - 1) → list1Sequence(Element[list1, i] / IsPrime[i], i, 1, (n * m)) → list2Sequence(Element[list1, i] / (¬IsPrime[i]), i, 1, (n * m)) → list3Max(((n + 1) * win), (1.1 * m)) → aMax((m + 1) / win, (1.1 * n)) → b
AI Drawing Prompt Reference
Create a square grid visualization mapping positive integers to cells, with rows and columns determined by two parameters. Each integer is placed sequentially into its corresponding cell. Highlight all prime-number cells with a distinct marker, while leaving non-prime cells blank or using a subtle style. The result is a rectangular lattice where prime positions form a sparse, irregular pattern, visually demonstrating how primes become less frequent as numbers grow. Include grid boundaries and optional text labels to aid in observing the density trend.
The prompt above was compiled from the original drawing commands and is for reference only.