
Graphing Functions on Paper
Loading the math board and drawing, please wait…
In collections
Primary School Mathematics Collection
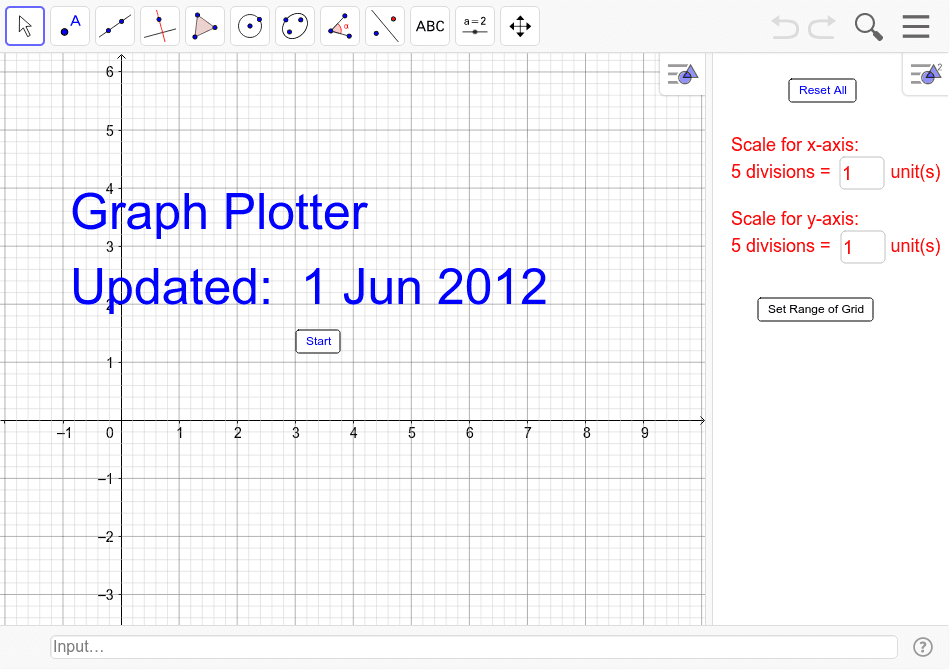
This example demonstrates how to graph functions on graph paper and export them in eps format for Word. It involves core math concepts like function graphs, median lines, dilations, parallelograms, and curve sketching. Constructed using GeoGebra commands like Sequence and Textfield, it allows interactive function plotting and parameter adjustments via input boxes and buttons. Ideal for high school math teaching on function graphing techniques and document creation.
GeoGebra Commands & Parameters
Sequence(Sequence[Segment[(xint2 * (j - 1) + xint1 * i, ymax), (xint2 * (j - 1) + xint1 * i, ymin)], i, 1, 4], j, 1, ceil(xmax / xint2)) → list5Sequence(Sequence[Segment[(-xint2 * (j - 1) - xint1 * i, ymax), (-xint2 * (j - 1) - xint1 * i, ymin)], i, 1, 4], j, 1, ceil(abs(xmin) / xint2)) → list5'Sequence(Sequence[Segment[(xmin, (j - 1) * yint2 + yint1 * i), (xmax, (j - 1) * yint2 + yint1 * i)], i, 1, 4], j, 1, ceil(ymax / yint2)) → list6Sequence(Sequence[Segment[(xmin, -(j - 1) * yint2 - yint1 * i), (xmax, -(j - 1) * yint2 - yint1 * i)], i, 1, 4], j, 1, ceil(abs(ymin) / yint2)) → list6'Sequence(Segment[(0 + xint2 * i, ymax), (0 + xint2 * i, ymin)], i, 1, ceil(xmax / xint2)) → list3Sequence(Segment[(-xint2 * i, ymax), (0 - xint2 * i, ymin)], i, 1, ceil(abs(xmin) / xint2)) → list3'Sequence(Segment[(xmin, yint2 * i), (xmax, yint2 * i)], i, 1, ceil(ymax / yint2)) → list4Sequence(Segment[(xmin, -yint2 * i), (xmax, -yint2 * i)], i, 1, ceil(abs(ymin) / yint2)) → list4'Textfield(xmax') → inputBox4Textfield(xmin') → inputBox5Textfield(ymin') → inputBox6Textfield(ymax') → inputBox7Textfield(yint1') → inputBox1Textfield(xint1') → inputBox2
AI Drawing Prompt Reference
Draw function graphs on graph paper with horizontal and vertical grid lines, and multiple parallel line segments representing median lines. Illustrate the process of graphing functions using adjustable parameters, including several function curves with varying parameters. Add interactive input boxes to adjust parameters, label the coordinate axis ranges and grid spacing, and export the final image in eps format for document use.
The prompt above was compiled from the original drawing commands and is for reference only.