
Completing Tables with Equations
Loading the math board and drawing, please wait…
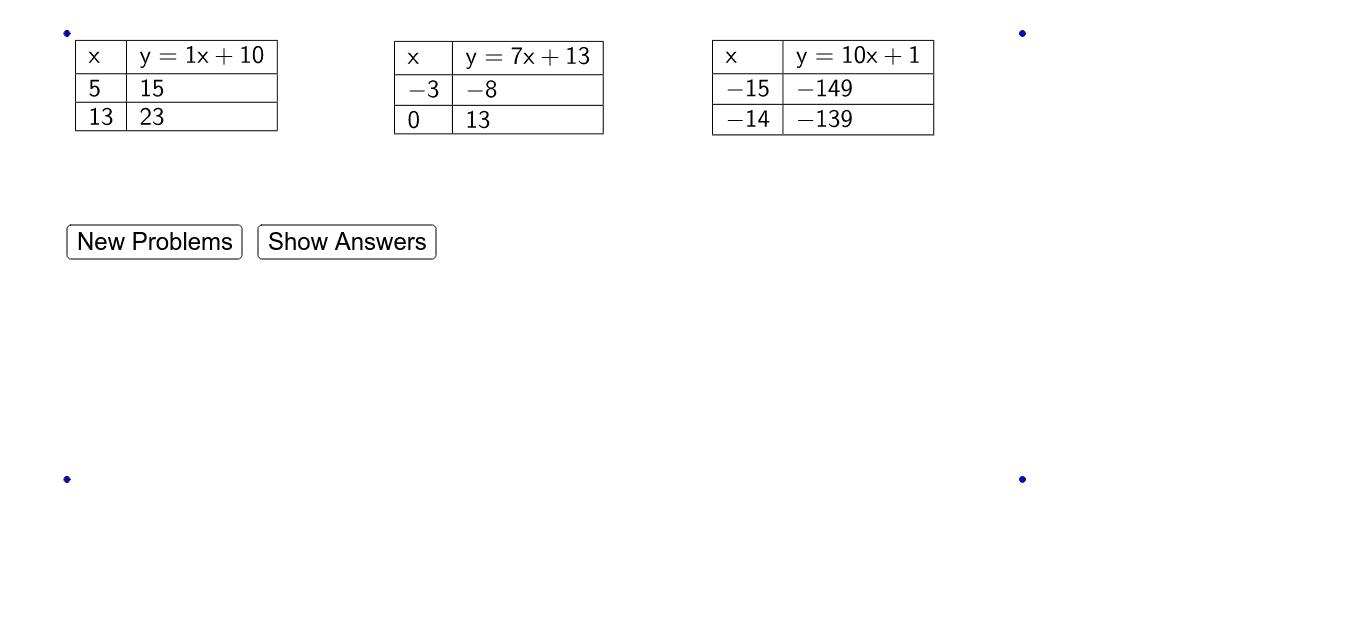
This example demonstrates how to use equations to complete numerical tables in GeoGebra, involving hyperbolas, percentages, angles, and tangent lines. It utilizes commands like RemoveUndefined, Element, Random, Text, If, FractionText, and TableText for construction. Ideal for high school mathematics education focusing on function and equation applications.
GeoGebra Commands & Parameters
RemoveUndefined(Sequence[(-21 + i)^(2) / (-21 + i), i, 1, 41]) → numersXElement(numersX, Random[21, 40]) → numerX1Element(numersX, Random[21, 40]) → numerX2Element(numersX, Random[21, 40]) → numerX3Element(numersX, Random[21, 40]) → numerX4Element(numersX, Random[21, 40]) → numerX5Element(numersX, Random[21, 40]) → numerX6Random(-20, 20) → X1ARandom(-20, 20) → X2ARandom(-20, 20) → X3ARandom(-20, 20) → X4ARandom(-20, 20) → X5ARandom(-20, 20) → X6ARandom(-20, 20) → X1BRandom(-20, 20) → X2BRandom(-20, 20) → X3BRandom(-20, 20) → X4BRandom(-20, 20) → X5BRandom(-20, 20) → X6BRandom(1, 20) → b1Random(1, 20) → b2Random(1, 20) → b3Random(1, 20) → b4Random(1, 20) → b5Random(1, 20) → b6Text(abs(numerX2)) → forTextNumber2Text(abs(numerX3)) → forTextNumber3Text(abs(numerX4)) → forTextNumber4Text(abs(numerX5)) → forTextNumber5Text(abs(numerX6)) → forTextNumber6If(numerX1 < 0, " - ", " ") → signX1If(numerX2 < 0, " - ", " ") → signX2If(numerX3 < 0, " - ", " ") → signX3If(numerX4 < 0, " - ", " ") → signX4If(numerX5 < 0, " - ", " ") → signX5If(numerX6 < 0, " - ", " ") → signX6Text(abs(numerX1)) → forTextNumber1Text(denomX1) → forTextDenomX1Text(denomX2) → forTextDenomX2Text(denomX3) → forTextDenomX3Text(denomX4) → forTextDenomX4Text(denomX5) → forTextDenomX5Text(denomX6) → forTextDenomX6If(b1 < 0, " - ", " + ") → signB1If(b2 < 0, " - ", " + ") → signB2If(b3 < 0, " - ", " + ") → signB3If(b4 < 0, " - ", " + ") → signB4If(b5 < 0, " - ", " + ") → signB5If(b6 < 0, " - ", " + ") → signB6Text(X1A) → forTextX1AText(X2A) → forTextX2AText(X3A) → forTextX3AText(X4A) → forTextX4AText(X5A) → forTextX5AText(X6A) → forTextX6AText(X1B) → forTextX1BText(X2B) → forTextX2BText(X3B) → forTextX3BText(X4B) → forTextX4BText(X5B) → forTextX5BText(X6B) → forTextX6BFractionText(y1B) → forTexty1BFractionText(abs(b1)) → forTextb1FractionText(abs(b2)) → forTextb2FractionText(abs(b3)) → forTextb3FractionText(abs(b4)) → forTextb4FractionText(abs(b5)) → forTextb5FractionText(abs(b6)) → forTextb6FractionText(outSide1) → forTextOutSide1FractionText(outSide2) → forTextOutSide2FractionText(outSide3) → forTextOutSide3FractionText(outSide4) → forTextOutSide4FractionText(outSide6) → forTextOutSide6FractionText(outSide5) → forTextOutSide5FractionText(y1A) → forTexty1AFractionText(y2A) → forTexty2AFractionText(y2B) → forTexty2BFractionText(y3A) → forTexty3AFractionText(y3B) → forTexty3BFractionText(y4A) → forTexty4AFractionText(y4B) → forTexty4BFractionText(y5A) → forTexty5AFractionText(y5B) → forTexty5BFractionText(y6A) → forTexty6AFractionText(y6B) → forTexty6BIf(showAnswers ≟ true, forTexty1A, " ") → B2If(showAnswers ≟ true, forTextX1B, " ") → A3If(showAnswers ≟ true, forTexty2A, " ") → E2If(showAnswers ≟ true, forTexty3A, " ") → H2If(showAnswers ≟ true, forTexty4A, " ") → K2If(showAnswers ≟ true, forTexty5A, " ") → N2If(showAnswers ≟ true, forTexty6A, " ") → Q2If(showAnswers ≟ true, forTextX2B, " ") → D3If(showAnswers ≟ true, forTextX3B, " ") → G3If(showAnswers ≟ true, forTextX4B, " ") → J3If(showAnswers ≟ true, forTextX5B, " ") → M3If(showAnswers ≟ true, forTextX6B, " ") → P3TableText({{A1, B1}, {A2, B2}, {A3, B3}}, "|_") → Table1TableText({{G1, H1}, {G2, H2}, {G3, H3}}, "|_") → Table3TableText({{J1, K1}, {J2, K2}, {J3, K3}}, "|_") → Table4TableText({{M1, N1}, {M2, N2}, {M3, N3}}, "|_") → Table5TableText({{P1, Q1}, {P2, Q2}, {P3, Q3}}, "|_") → Table6TableText({{D1, E1}, {D2, E2}, {D3, E3}}, "|_") → Table2
AI Drawing Prompt Reference
Create an educational diagram showing a table for completing equations. The table has six rows, each with a value defined as a fraction with a random integer numerator (from -20 to 20) and a random integer denominator (from 1 to 20). Next to each value, display its absolute value, and add a plus or minus sign before it based on its sign. Below or beside the table, show the corresponding equation form, such as "x²/x" or similar, and the computed result. The layout should be clear for classroom use, emphasizing filling in the table by substituting values.
The prompt above was compiled from the original drawing commands and is for reference only.