
Eigenvalue-Eigenvector Visualization
Loading the math board and drawing, please wait…
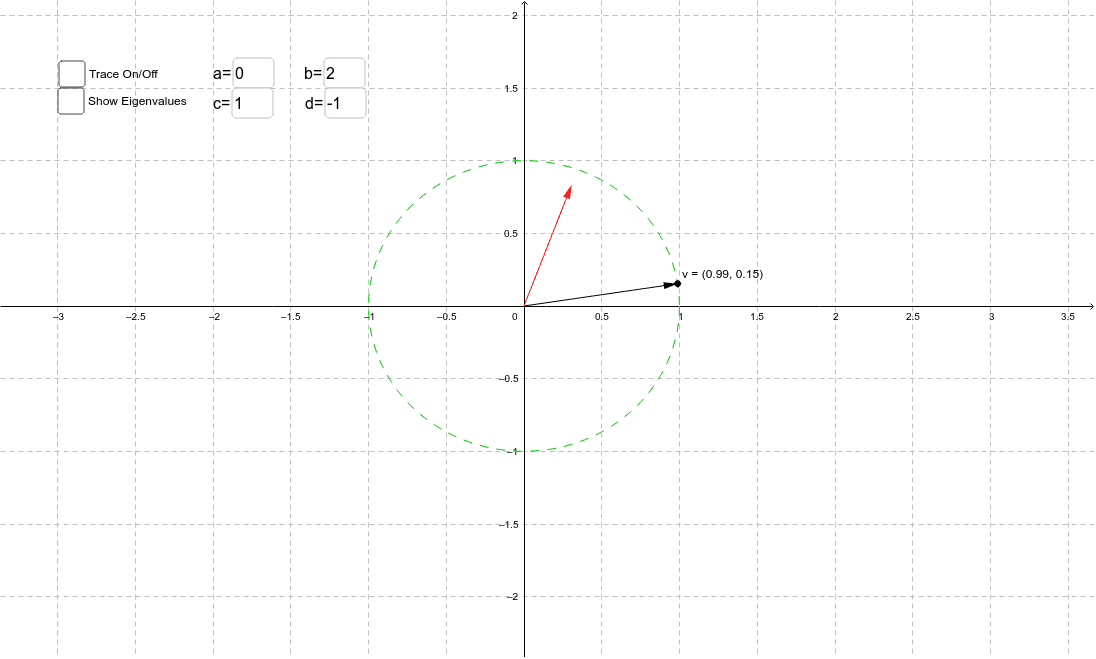
This example visualizes the concepts of eigenvalues and eigenvectors. By inputting a matrix, you can see how eigenvectors change under matrix transformation. Commands used: Textfield, Circle, Point, Vector; Objects: d, c, a, b, matrix1, inputBox1, inputBox2, inputBox3, inputBox4, e, v, X_1, Av, AX, p, E, x2_1, text1, f, g. Suitable for linear algebra courses.
GeoGebra Commands & Parameters
Textfield(a) → inputBox1Textfield(b) → inputBox2Textfield(c) → inputBox3Textfield(d) → inputBox4Circle((0, 0), 1) → ePoint(e) → vVector((0, 0), v) → X_1Vector((0, 0), Av) → AX
AI Drawing Prompt Reference
Draw a unit circle and select a point on it as an eigenvector. Then, input the four elements of a matrix to calculate its transformation under the matrix, and display the resulting vector.
The prompt above was compiled from the original drawing commands and is for reference only.