
Comparison of t and Normal Distributions
Loading the math board and drawing, please wait…
In collections
AP Statistics
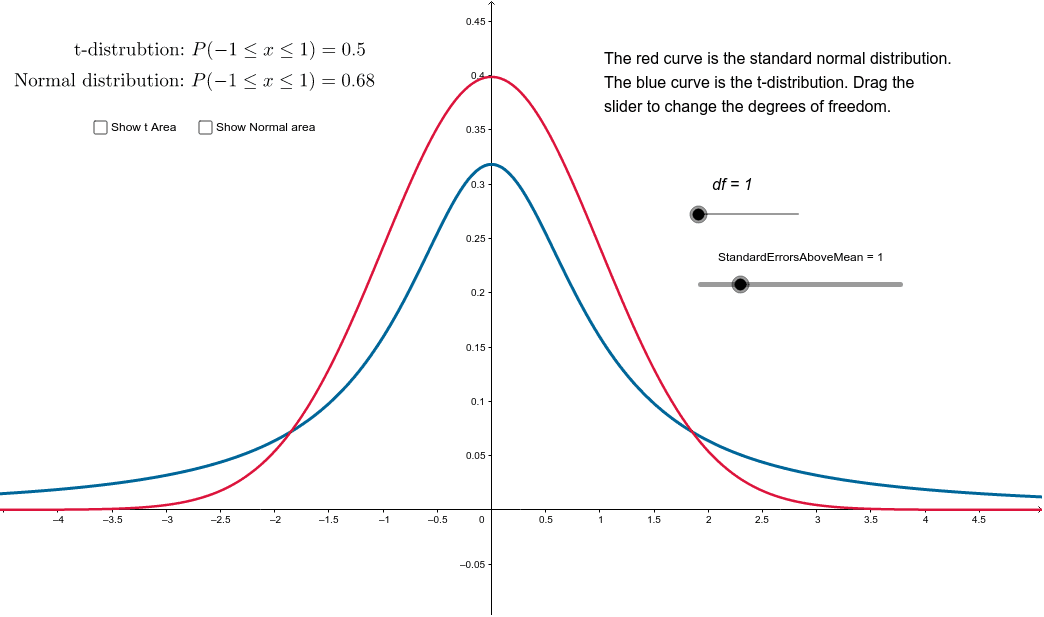
This example demonstrates the graphical comparison between the t-distribution and the normal distribution. It involves core mathematical concepts such as t-distribution, normal distribution, integral calculation, and standard errors in probability and statistics. The construction uses GeoGebra commands like TDistribution, Normal, and IntegralBetween, along with objects like df, text1, f, g, etc. It is suitable for high school and above students studying probability statistics or for teaching the differences between distributions.
GeoGebra Commands & Parameters
TDistribution(df, x) → fNormal(0, 1, x) → gIntegralBetween(f, 0, (-StandardErrorsAboveMean), StandardErrorsAboveMean) → bIntegralBetween(g, 0, (-StandardErrorsAboveMean), StandardErrorsAboveMean) → c
AI Drawing Prompt Reference
Create a statistical plot comparing the t-distribution and the standard normal distribution. Draw the t-distribution curve with a specified degree of freedom, and overlay the standard normal curve. Both curves are symmetric about the mean. Mark symmetric upper and lower bounds on the x-axis, where the distance from the mean is determined by a multiple of the standard error. Shade the area under each curve between these bounds using distinct colors or patterns to visually compare the integral areas. Include axes, curve labels, and a legend. The plot is suitable for teaching the differences between the two distributions.
The prompt above was compiled from the original drawing commands and is for reference only.