
Slope of Tangent and Derivative
Loading the math board and drawing, please wait…
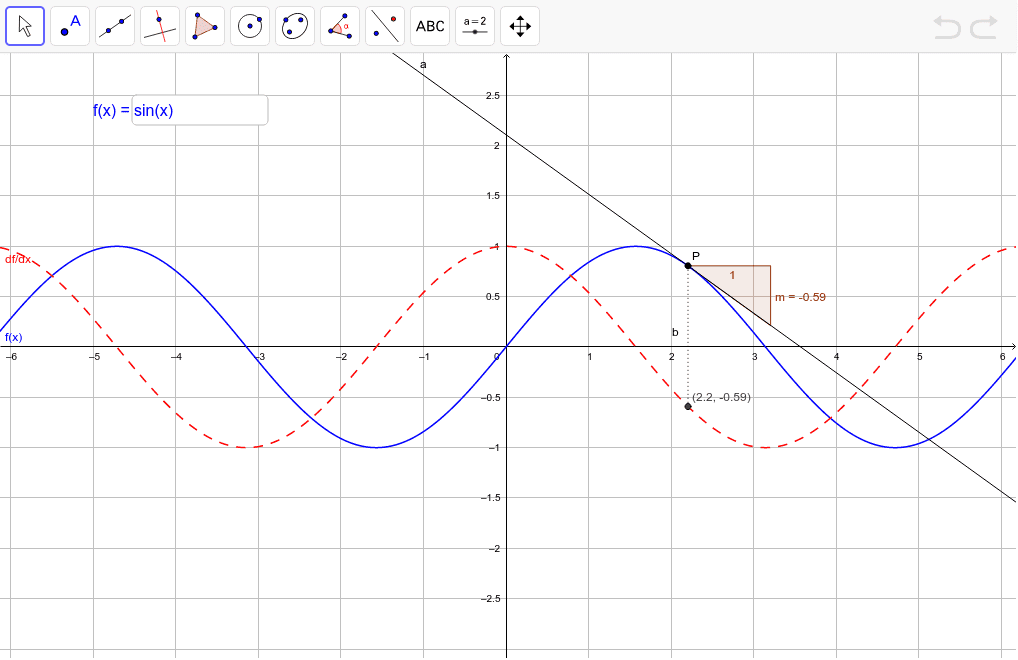
Move point P to observe the relationship between the slope of the tangent line and the derivative value. The red dashed curve represents the derivative of the given function. This example illustrates the concept of derivatives and their geometric meaning, involving tangent lines, slopes, and derivatives. It uses GeoGebra objects and commands such as functions, points, tangents, and slopes. Suitable for high school math education and learning calculus concepts.
GeoGebra Commands & Parameters
Textfield(f) → inputBox1Point(f) → PTangent(P, f) → aSlope(a) → mDerivative(f) → gSegment(P, A) → b
AI Drawing Prompt Reference
Draw a function graph and mark a point P. Draw the tangent line at P and measure its slope. Also, draw the derivative curve of the function. Show the relationship between P, the tangent line, the slope value, and the derivative curve to help understand the geometric meaning of the derivative.
The prompt above was compiled from the original drawing commands and is for reference only.