
Dynamic Visualization of Composite Functions
Loading the math board and drawing, please wait…
In collections
Fun with Functions
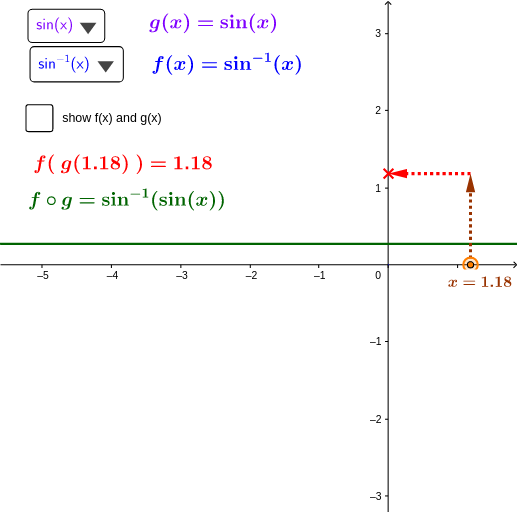
This example dynamically illustrates the flow of information in composite functions, showing how an input x value passes through a series of sub‑functions f₁, f₂, … to produce the final output y. The core mathematical concepts include the definition of composite functions, the interaction of linear and trigonometric functions, and introductory ideas of derivatives and integrals. In GeoGebra the construction uses CurveCartesian for graphing, Point, Line, Ray and other commands to build the visual interface, and lists such as glist and flist to manage multiple functions. It is suitable for high‑school and college students studying function composition, multi‑step transformations, and the connection between algebraic and geometric representations.
GeoGebra Commands & Parameters
Point(xAxis) → ASelectedIndex(glist) → ngElement(flist, ng) → gTextfield(f_{13}) → inputBox1SelectedIndex(flist) → nfElement(flist, nf) → fVector(A, B) → uVector(B, C) → vVector(A, A_1) → wVector(A_1, B_1) → aVector(B_1, D) → bVector(D, E) → cVector(E, C) → dDefined(gg) → gDefDefined(ff) → fDefLine(G, H) → eVector(B_1, GG) → hVector(GG, FF) → iPoint(yAxis) → IRay(I, Gy) → jCurveCartesian(0, t, f(t), t, -20, 20) → lCurveCartesian(t, g(t), 0, t, -20, 20) → Gp
AI Drawing Prompt Reference
Please draw a dynamic visualization of composite functions, showing the flow of information. The graphic should include points, line segments, rays, and curves. The input x value passes through a series of sub-functions f₁, f₂, … to produce the final output y. The construction order is: first define start and end points, then connect points to form line segments, then draw curves, and finally add rays. The graphic should reflect the interaction of linear and trigonometric functions, as well as basic ideas of derivatives and integrals.
The prompt above was compiled from the original drawing commands and is for reference only.