
Dynamic Illustration of Function Definition
Loading the math board and drawing, please wait…
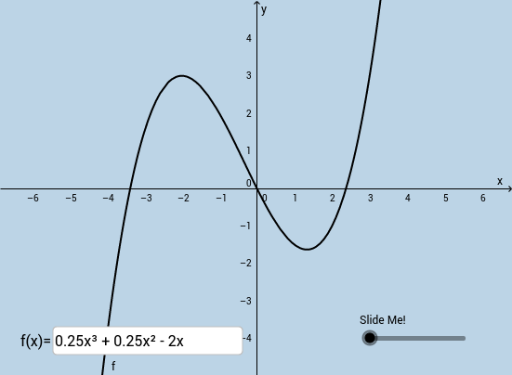
This example dynamically illustrates the definition of a function by representing functions as graphs, visually demonstrating the relationship between function images and points. Core math concepts include function definition, function graph, division, area, numbers, conic sections, and linear functions. It is constructed using GeoGebra commands like Point, Dilate, Vector, and Textfield with objects such as f, A, g, B, C, a, C', u, B', v, b, c, text1, text2, button1, and InputBox1. Suitable for high school mathematics teaching, helping students understand and practice function concepts and determination.
GeoGebra Commands & Parameters
Point(f) → ADilate(C, If[0 < a ≤ 1, 1 - a, 0], B) → C'Vector(C, C') → uDilate(B, If[1 < a ≤ 2, 2 - a, 0], A) → B'Vector(B, B') → vTextfield(f) → InputBox1