
Dot Plot Construction Problems
Loading the math board and drawing, please wait…
In collections
Charts & Graphs
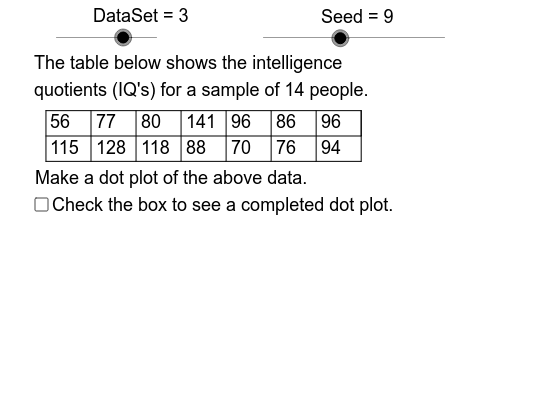
This example demonstrates how to create dot plots from various data sets using GeoGebra. It involves core mathematical concepts in statistics and data visualization. Key GeoGebra commands and objects used include Element, Mod, Sequence, Max, Min, Sort, CountIf, Segment, and DataSet, Dt4, Dt3, Dt2, Dt1, DataSeq, Data, RPSeq, Seed, Start, Rate, Size, Sample, SmpMx, SmpMn, SmpRng, CW, DB, DL, Rng, AccSq, Acc, AxUB, AxLB, AxScl, AxMn, AxMx, AxRng, DD4, DD3, DD2, Left, SF, LHgt, Right, DT, DM, RN1, Domain, Row1. It is suitable for middle school students and teachers for learning and teaching purposes.
GeoGebra Commands & Parameters
Element(DataSeq, DataSet) → DataMod(Seed, 5) → StartElement(RPSeq, Mod[Seed, 8] + 1) → RateSequence(Element[Data, Mod[Start + Rate * k, 20] + 1], k, 1, Size) → SampleMax(Sample) → SmpMxMin(Sample) → SmpMnElement(AccSq, DataSet) → AccMax(Acc, If[5 * AxLB ≤ AxUB, 5 * AxLB, If[2 * AxLB ≤ AxUB, 2 * AxLB, AxLB]]) → AxSclSequence(k, k, SmpMn, SmpMx, Acc) → DomainSequence(Element[Sample, k], k, 1, RN1) → Row1Sort(Intersection[Domain, Sample]) → RangeCountIf(x < SmpMx + 1, Range) → RangeCountSequence(CountIf[x ≟ Element[Range, k], Sample], k, 1, RangeCount) → FreqSegment(LE, RE) → AxisSequence(Element[Sample, k], k, RN1 + 1, Size) → Row2Segment(DVUL, DVUR) → TbTpSegment(DVML, DVMR) → TbMdSegment(DVLL, DVLR) → TbBtSegment(DVMR, DVUR) → RSCountIf(x > -1, Dt1) → Cnt1CountIf(x > -1, Dt3) → Cnt3CountIf(x > -1, Dt4) → Cnt4CountIf(x > -1, Dt2) → Cnt2Element(DDSeq, DataSet) → DDElement(AxLabSeq, DataSet) → AxLabCountIf(x ≠ (0, 0), Data) → DataSizeSequence(Segment[(DL + k * CW, DB), (DL + k * CW, DT)], k, 0, floor(Size / 2)) → VlinesSequence(Text[Element[Sample, k], (k * CW + DL - 4.5, DVT)], k, 1, ceil(Size / 2)) → DtRw1Sequence(Text[Element[Row2, k], (k * CW + DL - 4.5, DVB)], k, 1, floor(Size / 2)) → DtRw2Sequence(Sequence[(Adp(Element[Range, k]), LHgt + 0.05 * j), j, 1, Element[Freq, k]], k, 1, RangeCount) → DotsSequence(k, k, AxMn, AxMx, AxScl) → LbSqCountIf(x ≠ Infinity, LbSq) → LblCntSequence(Segment[(k * SF, LHgt - 0.01), (k * SF, LHgt + 0.01)], k, 0, AxRng, AxScl) → TicsSequence(Text[k, (Adp(k) - 0.9, LHgt - 0.08)], k, AxMn, AxMx, AxScl) → SclLbs
AI Drawing Prompt Reference
Create a data visualization chart showing how to represent different datasets using dot plots. Draw coordinate axes first, then generate a dot plot based on the data, with each data point corresponding to a point on a vertical line segment, the number of points indicating the frequency of occurrence for that data value. Finally, add ticks and labels to make the chart clear and easy to understand.
The prompt above was compiled from the original drawing commands and is for reference only.