
Dilation Exploration: Dynamic Scaling from Shapes to Vectors
Loading the math board and drawing, please wait…
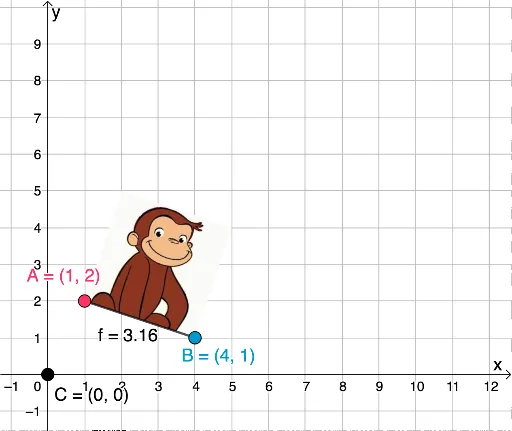
①This GeoGebra example dynamically demonstrates dilation (scaling) transformations, showing how a figure enlarges or shrinks proportionally about a center, and encourages exploratory discovery. ②Core math concepts include dilation, similarity, scale factor, vectors and coordinate representation, as well as the effects on area and perimeter, with visual links to distributions, variance, and percentages. ③Construction: Based on the summary, it uses the Segment command with objects A, B, pic1 (an image), f (a function or curve), and C (likely the center or control point), allowing users to drag points or sliders to change the scale and observe the transformation. ④Suitable for middle/high school geometry classes, math labs, or self-study, helping learners grasp the geometric essence of transformations and serving as an entry point to vector and coordinate geometry.
GeoGebra Commands & Parameters
Segment(A, B) → f
AI Drawing Prompt Reference
Create a dynamic scaling illustration showing a geometric shape (e.g., a triangle or simple polygon) that enlarges or shrinks proportionally about a fixed center point. Include a draggable control point or slider to adjust the scale factor, with the original and scaled shapes displayed together for comparison. Draw dashed lines connecting corresponding vertices to the center to emphasize the dilation relationship. Add a coordinate grid in the background to help visualize changes in side lengths and area. The composition should clearly show the center, original shape, scaled shape, and their geometric connections.
The prompt above was compiled from the original drawing commands and is for reference only.