
Definite Integral Play: Dynamic Area Under a Curve
Loading the math board and drawing, please wait…
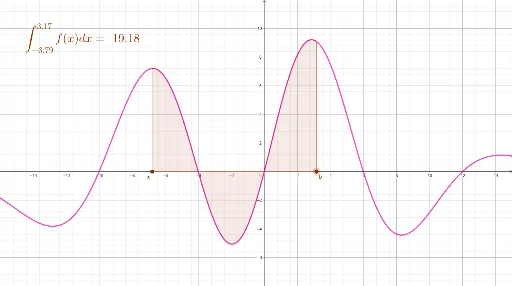
① This interactive GeoGebra example dynamically visualizes the definite integral as the area between a function curve and the x-axis. ② It covers core calculus concepts: the geometric meaning of definite integrals, the role of integration limits, and how changing bounds affects the accumulated area. ③ Construction uses the Point command to create draggable points for the lower and upper limits a and b, the Integral command to generate the shaded region and compute its value, plus a text object (text1) that updates the numeric result in real time; view ranges (xmin, xmax, ymin, ymax) are set for a clear display. ④ Ideal for high school seniors or early college students learning calculus, this example serves as a hands-on tool for classroom demonstrations or self-study to grasp the fundamental connection between integration and area.
GeoGebra Commands & Parameters
Point(xAxis) → aPoint(Segment[(x(a) + 0.1, 0), (20, 0)]) → bIntegral(f, x(a), x(b)) → c