
Data Summarization Visualization: Cumulative Frequency Table, Box Plot, and Ogiv
Loading the math board and drawing, please wait…
In collections
Frequency distribution
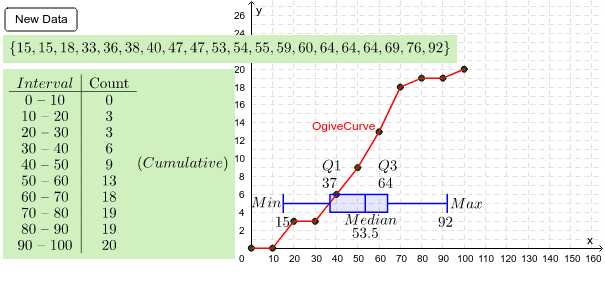
This example demonstrates how to visualize a random data set using cumulative frequency tables, box plots, and ogive curves. Key mathematical concepts include frequency distribution, percentiles, and data sorting. Construction involves GeoGebra commands like Sequence, Sort, FrequencyTable, and BoxPlot. Suitable for middle school students learning statistics or high school students practicing data analysis.
GeoGebra Commands & Parameters
Sequence(Random[(i * 2), 100 - (i * 2)], i, 1, 20) → RandlistMin(Randlist) → LeastMax(Randlist) → MostMedian(Randlist) → MedQ1(Randlist) → Q_1Q3(Randlist) → Q_3Sort(Randlist) → SortedSegment((Least, 2), (Least, 4)) → minsegSegment((Least, 3), (Q_1, 3)) → TailsegSegment((Q_1, 2), (Q_1, 4)) → q1seqSegment((Q_3, 2), (Q_3, 4)) → q3seqSegment((Q_1, 2), (Q_3, 2)) → midsegbottomSegment((Q_1, 4), (Q_3, 4)) → midsegtopSegment((Most, 2), (Most, 4)) → maxsegSegment((Most, 3), (Q_3, 3)) → headsegSegment((Med, 2), (Med, 4)) → medsegFrequencyTable(classlist, Randlist) → freqFrequencyTable(true, classlist, Randlist) → cumfreqFrequency(true, classlist, Sorted) → CFreqPointList(Sequence[{Element[classlist, i], Element[CFreq, i]}, i, 1, 20]) → OgivepointsPointList(Sequence[{Element[classlist, i + 1], Element[CFreq, i]}, i, 1, 10]) → Ogive2ptsInsert((0, 0), Ogive2pts, 1) → Ogive3ptsPolyLine(Ogive3pts) → OgiveCurveBoxPlot(5, 1, Least, Q_1, Med, Q_3, Most) → a
AI Drawing Prompt Reference
Draw a statistical visualization showing a random dataset with a cumulative frequency table, a box plot, and an ogive curve. Generate 20 random data points and compute their minimum, maximum, median, lower quartile, and upper quartile. Construct a box plot with a horizontal box from the lower to upper quartile, a vertical line at the median, and whiskers extending to the minimum and maximum, with short vertical caps at the ends. Sort the data and divide into classes, then calculate frequencies and cumulative frequencies. Plot points at class boundaries with cumulative frequencies and connect them with a polyline to form the ogive. Also display the cumulative frequency table values in the figure.
The prompt above was compiled from the original drawing commands and is for reference only.