
Data Set Visualization
Loading the math board and drawing, please wait…
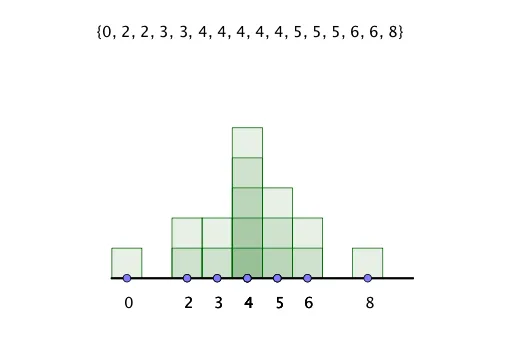
This example demonstrates how modifying a visualization directly impacts the set of data. Core math concepts include statistics, median value, circle, rotation, exponential functions, and power functions. It uses commands/objects like Segment, Point, Line, Frequency, Mode, Sequence, Sort, and Text in GeoGebra for construction. Suitable for high school mathematics education to help students understand the relationship between data statistics and function transformations.
GeoGebra Commands & Parameters
Segment((0, 0), (9, 0)) → gPoint(g) → MPoint(g) → QPoint(g) → NPoint(g) → LPoint(g) → KPoint(g) → PPoint(g) → CPoint(g) → DPoint(g) → EPoint(g) → FPoint(g) → GPoint(g) → HPoint(g) → IPoint(g) → JPoint(g) → RPoint(g) → OLine(A, B) → fFrequency(list4, list1) → list5Segment((-0.5, 0), (9.5, 0)) → iMode(list1) → list3Mode(list1) → list6Sequence(Sequence[Polygon[(n - 0.5, 0), (n - 0.5, k), (n + 0.5, k), (n + 0.5, 0)], k, 1, Element[list5, n + 1], 1], n, 0, 9, 1) → list2Sort(list1) → numbersText(numbers) → text18
AI Drawing Prompt Reference
Draw a line segment from 0 to 9, mark points on it, and draw a line. Create a frequency graph to show data distribution, then generate a series of rectangles based on frequency values and arrange them in order. Text displays sorted numbers.
The prompt above was compiled from the original drawing commands and is for reference only.